The purpose of this blog is the creation of an open, international, independent and free forum, where every UFO-researcher can publish the results of his/her research. The languagues, used for this blog, are Dutch, English and French.You can find the articles of a collegue by selecting his category. Each author stays resposable for the continue of his articles. As blogmaster I have the right to refuse an addition or an article, when it attacks other collegues or UFO-groupes.
Druk op onderstaande knop om te reageren in mijn forum
Zoeken in blog
Deze blog is opgedragen aan mijn overleden echtgenote Lucienne.
In 2012 verloor ze haar moedige strijd tegen kanker!
In 2011 startte ik deze blog, omdat ik niet mocht stoppen met mijn UFO-onderzoek.
BEDANKT!!!
Een interessant adres?
UFO'S of UAP'S, ASTRONOMIE, RUIMTEVAART, ARCHEOLOGIE, OUDHEIDKUNDE, SF-SNUFJES EN ANDERE ESOTERISCHE WETENSCHAPPEN - DE ALLERLAATSTE NIEUWTJES
UFO's of UAP'S in België en de rest van de wereld Ontdek de Fascinerende Wereld van UFO's en UAP's: Jouw Bron voor Onthullende Informatie!
Ben jij ook gefascineerd door het onbekende? Wil je meer weten over UFO's en UAP's, niet alleen in België, maar over de hele wereld? Dan ben je op de juiste plek!
België: Het Kloppend Hart van UFO-onderzoek
In België is BUFON (Belgisch UFO-Netwerk) dé autoriteit op het gebied van UFO-onderzoek. Voor betrouwbare en objectieve informatie over deze intrigerende fenomenen, bezoek je zeker onze Facebook-pagina en deze blog. Maar dat is nog niet alles! Ontdek ook het Belgisch UFO-meldpunt en Caelestia, twee organisaties die diepgaand onderzoek verrichten, al zijn ze soms kritisch of sceptisch.
Nederland: Een Schat aan Informatie
Voor onze Nederlandse buren is er de schitterende website www.ufowijzer.nl, beheerd door Paul Harmans. Deze site biedt een schat aan informatie en artikelen die je niet wilt missen!
Internationaal: MUFON - De Wereldwijde Autoriteit
Neem ook een kijkje bij MUFON (Mutual UFO Network Inc.), een gerenommeerde Amerikaanse UFO-vereniging met afdelingen in de VS en wereldwijd. MUFON is toegewijd aan de wetenschappelijke en analytische studie van het UFO-fenomeen, en hun maandelijkse tijdschrift, The MUFON UFO-Journal, is een must-read voor elke UFO-enthousiasteling. Bezoek hun website op www.mufon.com voor meer informatie.
Samenwerking en Toekomstvisie
Sinds 1 februari 2020 is Pieter niet alleen ex-president van BUFON, maar ook de voormalige nationale directeur van MUFON in Vlaanderen en Nederland. Dit creëert een sterke samenwerking met de Franse MUFON Reseau MUFON/EUROP, wat ons in staat stelt om nog meer waardevolle inzichten te delen.
Let op: Nepprofielen en Nieuwe Groeperingen
Pas op voor een nieuwe groepering die zich ook BUFON noemt, maar geen enkele connectie heeft met onze gevestigde organisatie. Hoewel zij de naam geregistreerd hebben, kunnen ze het rijke verleden en de expertise van onze groep niet evenaren. We wensen hen veel succes, maar we blijven de autoriteit in UFO-onderzoek!
Blijf Op De Hoogte!
Wil jij de laatste nieuwtjes over UFO's, ruimtevaart, archeologie, en meer? Volg ons dan en duik samen met ons in de fascinerende wereld van het onbekende! Sluit je aan bij de gemeenschap van nieuwsgierige geesten die net als jij verlangen naar antwoorden en avonturen in de sterren!
Heb je vragen of wil je meer weten? Aarzel dan niet om contact met ons op te nemen! Samen ontrafelen we het mysterie van de lucht en daarbuiten.
30-01-2024
ARE SIGHTING CAPTURED IN PHOTOS REVEALS AN OCEAN ‘MONSTER’ YOU’VE NEVER SEEN LIKE THIS
(Unsplash
ARE SIGHTING CAPTURED IN PHOTOS REVEALS AN OCEAN ‘MONSTER’ YOU’VE NEVER SEEN LIKE THIS
In the summer of 2023, Carlos Guana, a wildlife filmmaker and storyteller, and Phillip Sternes, a biology doctoral student at the University of California Riverside, set out on an expedition off the central coast of California to film great white sharks and other wildlife in the Pacific waters near Santa Barbara.
On July 9, 2023, while operating his Mavic 3 Pro aerial drone approximately a quarter mile off the coast of Carpinteria, California, Guana spotted something striking and beautiful moving beneath the ocean surface.
Although the creature was familiar in appearance—a small, almost ghostly pale white shark—neither Guana nor Sternes immediately recognized what the drone’s camera had managed to capture at the time.
It wasn’t until later while rewatching the footage that they noticed something odd about the shark’s appearance.
“Upon close examination of video and photos, the individual’s pale color appears to be a thin white film covering the shark,” Guana and Sternes would later write. “We noted that as the shark was swimming, the whitish film was being sloughed off.”
The infant great white shark Sternes and Gauna observed, as seen from the front
(Carlos Gauna/The Malibu Artist).
Although it seemed possible that the unusual film might have been caused by some kind of skin disorder that neither of the observers recognized, nor could it be found in the available literature on white sharks, a more likely possibility soon presented itself: this might be the remains of intrauterine material left over from the creature’s seemingly very recent birth.
If the latter were true, it would be an unprecedented sighting, given that what Guana and Sternes had filmed was likely a baby great white shark and the first of its kind ever captured on film.
“We enlarged the images, put them in slow motion, and realized the white layer was being shed from the body as it was swimming,” Sternes said in a recent statement about their discovery.
Now, their discovery has been reported in a new paper that appeared in the Environmental Biology of Fishes journal.
Great whites are among the most famous shark species, partially due to their famous, monstrous depiction in films like Jaws. Despite the attention the species has received, many things about them remain mysterious to ocean scientists.
Guana, who is known online as The Malibu Artist, has filmed these and other species of sharks in locations all over the world, documenting an impressive amount of footage of the creatures where they are often shown swimming frighteningly close to beachgoers.
His footage of these enigmatic ocean predators has racked up millions of views online, but the new images could offer scientists new clues about one of the most perplexing mysteries involving great white sharks.
“Where white sharks give birth is one of the holy grails of shark science,” Guana said in a statement. “No one has ever been able to pinpoint where they are born, nor has anyone seen a newborn baby shark alive.”
“There have been dead white sharks found inside deceased pregnant mothers,” Guana says, “But nothing like this.”
The suspected newborn great white shark, observed from the side
(Carlos Gauna/The Malibu Artist).
Like mammals, young great sharks are born live, and it is believed that they might feed on unfertilized eggs while still in the embryonic stage, along with a milky substance secreted within the uterus of the mother that provides additional nourishment.
It is the remnants of this intrauterine milk that Sternes and Guana believe they observed on the shark they filmed last July.
Other key observations also point to the likelihood that what they filmed represents the first imagery of a baby great white shark. While filming in the area, the pair observed several very large—and potentially pregnant—female great whites nearby.
By comparison, the small shark they captured in imagery with Guana’s drone is very small, and its appearance and behavior both suggest a very young creature—perhaps as little as a day, or even just a few hours old.
Also of interest is that the coastal waters of central California had already been put forward in the past as a potential birthing location for great whites. Hence, the pup that Guana and Sternes observed was in the right place, and at the right time, to be a likely match for a newborn great white.
White sharks are a protected species, although Guana and Sternes note in their paper that fishermen do sometimes inadvertently catch these sharks, some of which may die resulting from stress or injuries.
If the central California coast is indeed a breeding ground for white sharks, as opposed to waters much further offshore, as some past studies have suggested, then a greater level of management may be required to help ensure the conservation of the species and their habitat.
Ultimately, Guana and Sternes write that their aerial drone footage “has provided shark science with another interesting set of information,” adding that “future drone observations of sharks in this area will greatly improve our knowledge and understanding of white shark life history.”
Their recent paper, “Novel aerial observations of a possible newborn white shark (Carcharodon carcharias) in Southern California,” can be read online here, along with additional imagery of the white shark they observed in July 2023.
Wetenschappers zien het nog minstens net zo somber in als een jaar geleden: de doemdagklok blijft ook in 2024 hangen op 90 seconden voor middernacht. En daarmee bevinden we ons – net als in 2023 – nog altijd dichter bij de ondergang van planeet en mensheid dan in de zeven decennia hiervoor het geval was.
Dat heeft het Bulletin of the Atomic Scientists zojuist bekend gemaakt. De organisatie boog zich over de situatie in de wereld en kan niet anders dan concluderen dat deze in het afgelopen jaar nauwelijks verbeterd is en de dreiging dat we de planeet en/of onszelf vernietigen nog minstens net zo groot is als in 2023; het jaar waarin de doemdagklok (zie kader) op een ongeëvenaarde 90 seconden voor 12 werd gezet. En dus blijft de klok ook in 2024 op 90 seconden voor 12 staan.
Wat is de doemdagklok? De doemdagklok werd in 1947 in het leven geroepen om in één oogopslag weer te kunnen geven in hoeverre de mensheid erop afstevent de planeet (en misschien zelfs zichzelf) te vernietigen. Daarbij wordt de klok steevast op een aantal minuten voor middernacht gezet, waarbij middernacht dus symbool staat voor de apocalyps. In de tijd dat de doemdagklok geboren werd – kort na de Tweede Wereldoorlog – vreesde men sterk dat de inzet van kernwapens de apocalyps zou inluiden. En bij het bepalen van de tijd op de doemdagklok werd in beginsel dan ook vooral gekeken naar de ontwikkeling van die wapens en de mate waarin landen dreigden met inzet ervan. Het resulteerde erin dat de doemdagklok in het jaar van oprichting – 1947 dus – op 7 minuten voor middernacht werd gezet, maar in 1953 – de Koude Oorlog was toen in volle gang – op 2 minuten voor 12 kwam te staan. Inmiddels zijn kernwapens lang niet meer de enige dreiging die in overweging wordt genomen alvorens de wijzers van de doemdagklok worden verzet. Zo wordt sinds 2017 bijvoorbeeld ook de dreiging van de catastrofale effecten van klimaatverandering meegenomen. Waar de wijzers van de doemdagklok temidden van al het tumult in de wereld op uitkomen wordt met enige regelmaat besproken binnen een speciaal comité – het Science and Security Board van het Bulletin of the Atomic Scientists – waarin vooraanstaande wetenschappers zitting hebben.
2023 Vorig jaar zetten wetenschappers de doemdagklok dus op 90 seconden voor middernacht. Dat was ongeëvenaard: nog nooit hadden de wijzers zo dicht bij middernacht gestaan. Het was vooral te wijten aan de oorlog in Oekraïne en het feit dat Rusland in het kader daarvan met enige regelmaat met de inzet van kernwapens dreigt.
Oorlogen en kernwapens Met het aanbreken van 2024 hebben wetenschappers zich opnieuw over de wereldwijde situatie gebogen, om vervolgens te bepalen of de wijzers van de doemdagklok al dan niet voor- of achteruit moesten worden gezet. Die overwegingen werden opnieuw overschaduwd door de oorlog in Oekraïne, maar ook door de in oktober vorig jaar uitgebroken oorlog in Gaza, zo laat de onderzoekscommissie in kwestie weten. Die laatstgenoemde oorlog kan zomaar leiden tot een grootschaliger conflict in de regio, met alle gevolgen van dien. Daarnaast hebben de onderzoekers grote zorgen over het feit dat landen als China en en Rusland druk bezig zijn om hun nucleaire wapenarsenalen te moderniseren en uit te breiden. Een nieuwe kernwapenwedloop ligt op de loer, zo waarschuwen ze.
Klimaat en AI Maar er zijn meer zorgen. Bijvoorbeeld over ons klimaat: 2023 was het warmste jaar ooit, waarin overstromingen, natuurbranden en andere klimaatgerelateerde rampen miljoenen mensen troffen. Ook zijn de onderzoekers bezorgd over de razendsnelle opkomst van kunstmatige intelligentie (KI): een ontwikkeling die de mensheid ten goede kan komen, maar voor hetzelfde geld ook kan bedreigen en op dit moment nauwelijks door overheden gecontroleerd wordt. “Vergis je niet,” zo benadrukt Rachel Bronson namens het Bulletin of the Atomic Scientists. “Dat de klok op 90 seconden voor middernacht blijft staan, wil niet zeggen dat de wereld stabiel is. In tegendeel zelfs. Het is de hoogste tijd voor overheden en samenlevingen wereldwijd om in actie te komen.”
Eerdere tijden In 2023 stond de klok op 90 seconden voor middernacht. En daarmee stond de mensheid er slechter voor dan in 2022 toen de klok op 100 seconden voor middernacht bleef hangen. Dat wetenschappers wel eens aanzienlijk optimistischer zijn geweest over het lot van de mensheid staat vast; in 1991 stond de klok nog op 17 minuten voor 12 en reflecteerde zo de rust die het einde van de Koude Oorlog had gebracht. Maar die rust was van korte duur. Want in de jaren die volgden, kropen de wijzers steeds iets dichter naar middernacht: van 14 minuten voor 12 in 1995 naar 7 minuten voor 12 in 2002. Nog eens tien jaar later staat de klok op 5 voor 12 en in 2018 komt deze op het niveau van het Koude Oorlogsjaar 1953, met een tijd van 2 voor 12. En in 2020 komt deze zelfs op een ongeëvenaarde 100 seconden voor middernacht te staan. Een droevig record dat in 2023 dus alweer verbroken wordt en ook in 2024 standhoudt.
Reële dreiging En zo schetst de doemdagklok al jaren een weinig rooskleurig beeld. Maar tegelijkertijd zijn we er gewoon nog. Het roept bij de wat sceptischer aangelegde geesten wellicht de vraag op of de angst voor de apocalyps eigenlijk wel terecht is. Wetenschappers kunnen er kort over zijn: die angst fluctueert misschien door de jaren heen, maar is zeker reëel. “Zolang kernwapens bestaan en gebruikt kunnen worden, is er ook een kans dat we onze beschaving vernietigen (…) En zolang het klimaat blijft veranderen, is er een kans dat we daar gevolgen van ondervinden die een bedreiging vormen voor de overleving van onze soort.”
Maar er is altijd hoop Maar de Doemdagklok is niet bedacht met het idee de mensheid een collectieve depressie aan te praten. Juist niet. Wetenschappers willen mensen aan het denken zetten, waarschuwen en in actie laten komen. “Mensen hebben zowel kernwapens als de door fossiele brandstoffen aangedreven machines die bijdragen aan klimaatverandering, bedacht. We weten hoe ze werken, dus is het aannemelijk dat we ook manieren kunnen vinden om de dreiging die ervan uitgaat, te verminderen,” zo is op de site van het Bulletin of the Atomic Scientists te lezen.
Titanic Vooralsnog lijkt het er echter niet op dat wereldleiders echt van de ernst van de situatie doordrongen zijn, zo moet Jerry Brown, voorzitter van het Bulletin of the Atomic Scientists vaststellen. “Net als op de Titanic sturen leiders de wereld richting een catastrofe: meer kernbommen, enorme koolstofemissies, gevaarlijke ziekteverwekkers en KI. Alleen de grootmachten zoals China, Amerika en Rusland kunnen ons nog redden. Ondanks grote vijandschap moeten zij gaan samenwerken – anders zijn we verloren.”
Het klinkt weinig hoopgevend. Maar de wetenschappers houden hoop, zo laat Bronson weten. “Wat ons hoopvol stemt en inspireert is dat we zien dat jongere generaties de leiding nemen.” Over een jaar moet blijken of dat in 2025 dan misschien genoeg is om de grote wijzer wat terug te draaien.
De waarheid over microplastics Microplastics zijn overal. Ze zijn op de meest afgelegen plaatsen gevonden; bij zeedieren die in de diepste loopgraven van de oceaan leven, begraven in zee-ijs op Antarctica, en in drinkwater over de hele wereld. Deze fragmenten worden via een aantal verschillende kanalen verspreid en nu worden ze ook in het menselijk lichaam aangetroffen. Nu besmetting onvermijdelijk wordt, is het tijd om de effecten van deze vervuilende stof op zowel het milieu als onze fysieke gezondheid te leren kennen en volledig te begrijpen.
Klik op de volgende foto's en uitleg om de waarheid over microplasticvervuiling te ontdekken.
Kleine stukjes plastic Uit een onlangs vrijgegeven onderzoek is gebleken dat flessenwater honderdduizenden ‘nanoplastics’ bevat. Deze kleine fragmenten zijn slechts 100 nanometer (of minder) groot.
Nanoplastics zijn alomtegenwoordig in stedelijke wateren. Ze hebben verschillende kenmerken in vergelijking met microplastics, en vanwege hun omvang is het zelfs nog moeilijker om ze te analyseren.
Flessen water Een gemiddelde liter plastic fles water bevat volgens onderzoekers van Columbia en Rutgers in de VS bijna een kwart miljoen nanoplasticfragmenten.
Onderzoek De onderzoekers ontdekten dat een groot deel van de consumptie uit de waterfles zelf kwam, en het is onbekend of dit een ernstig risico voor de volksgezondheid met zich meebrengt.
WHO-bevindingen In 2019 concludeerde de Wereldgezondheidsorganisatie dat er niet genoeg bewijs was om aan te tonen dat de consumptie of het inademen van microplastics een risico vormde.
WHO-bevindingen Ze waarschuwden echter dat deeltjes die kleiner zijn dan 10 micrometer meer dan waarschijnlijk biologisch zullen worden opgenomen, en riepen op tot een vermindering van de plasticvervuiling.
Microplastics in voedsel Maar onze blootstelling aan microplastics beperkt zich niet alleen tot het water dat we drinken. Ze worden ook verspreid op landbouwgrond, om uiteindelijk in het voedsel dat we eten terecht te komen.
Microplastics in landbouwgrond Uit een analyse uit 2022 bleek dat het rioolslib dat wordt gebruikt om gewassen te bemesten bijna 20 miljoen hectare Amerikaanse landbouwgrond heeft vervuild.
Riolering Het is ook bewezen dat de 'forever chemicaliën', oftewel PFA's (per- en polyfluoralkylstoffen), en microplastics die in het slib worden aangetroffen, elk jaar de Europese landbouwgronden vervuilen.
Plastic in elke hap Of we het ons nu realiseren of niet, elke hap die we nemen kan microplastics bevatten. Plastic lijkt zich het meest op te hopen in de wortels van groenten, dus wortelen, radijsjes en rapen kunnen grotere hoeveelheden bevatten dan bijvoorbeeld groene bladgroenten.
Microplastics in de longen In 2022 ontdekten wetenschappers voor het eerst microdeeltjes in menselijke longen en bloed. De ontdekking onderstreepte de urgentie van de noodzaak om alternatieven voor plastic te vinden.
Consumentenproducten De bron van de microplastics die in het menselijk lichaam worden aangetroffen varieert, maar consumentenproducten zoals plastic flessen, textielvezels (vooral in polyester) en voedselverpakkingen die in de oceaan, de lucht, zeevruchten en zelfs zout worden aangetroffen, zijn de meest waarschijnlijke bronnen.
Consumptie Er wordt aangenomen dat Amerikanen dagelijks ongeveer 126 deeltjes microplastics consumeren en 132 deeltjes microplastics inademen. Terwijl de meeste hiervan door de darmen gaan en het lichaam verlaten, blijven andere in kleine hoeveelheden achter en hopen zich op.
Afbraak van microplastics Microplastics zijn gemaakt van giftige, schadelijke verbindingen zoals weekmakers, stabilisatoren, vulstoffen en smeermiddelen die tientallen jaren lang niet worden afgebroken.
Afbraak van microplastics Er wordt uitgebreid onderzoek gedaan om te bepalen wat de langetermijneffecten van deze microplastics in het lichaam zullen zijn, gezien hun langzaam afbrekende karakter.
BPA BPA, een veel voorkomende chemische stof die in plastic wordt gebruikt, is een bekende hormoonontregelaar (hormoonsysteemverstoorder), en veel bedrijven produceren nu BPA-vrij plastic. Maar het is niet de enige.
Kankerverwekkend Veel andere chemicaliën in kunststoffen zijn ook hormoonontregelaars en kankerverwekkend. Chronische ziekten zoals hartziekten en diabetes houden verband met de uitstoot van deze chemicaliën
Sterk bewerkte voedingsmiddelen Microplastics breken af van grotere stukken plastic en komen via het productie- en opslagproces in voedsel terecht. Hoe beter het voedsel is bewerkt, hoe groter de hoeveelheid microplastics die erin zit.
PET-kunststoffen Waterflessen met PET-plastic (polyethyleentereftalaat) zijn gemeengoed geworden, maar plastic deeltjes worden uitgeloogd in de drank die erin zit, wat in je bloed terecht kan komen
Onvermijdelijk? Hoewel er stappen zijn die we als individu kunnen nemen om onze consumptie van microplastics terug te dringen, maakt de populatie microplastics het consumeren ervan in een of andere vorm onvermijdelijk.
Productiebedrijven Miljoenen tonnen microplastics worden geproduceerd door productiebedrijven, om vervolgens in watermassa’s te belanden die over de hele wereld circuleren.
Plastic vervuiling Grotere kunststoffen die in waterlichamen worden aangetroffen, worden door de zon afgebroken tot kleine kunststoffen die in de drinkwatervoorziening terecht kunnen komen.
De waarheid over recycling Het merendeel van het plastic dat voor recycling wordt verzonden, wordt niet gerecycled. Veel van de plastic flessen en tassen die worden verzonden, belanden uiteindelijk op een stortplaats.
Overmatig gebruik van plastic In het dagelijks leven is onze afhankelijkheid van plastic verpakkingen verbazingwekkend. Vooral voedselverpakkingen zijn overbodig: groenten en fruit hoeven niet in plastic verpakt te worden, maar vaak wel.
Regulatie In de VS is de afgelopen jaren bezuinigd op de regelgeving en het milieubeschermingsbeleid. Deze zullen van invloed zijn op de toekomst van de consumptie van microplastics.
Kleren Een andere mogelijke manier waarop microplastics door het lichaam kunnen worden opgenomen, is via kleding. Vaak zal goedkoper gemaakte kleding een hoger gehalte aan synthetische materialen bevatten. Hierdoor lopen mensen met een lager inkomen een groter risico op dit soort besmettingen.
Het kan lang duren voordat biologisch afbreekbare kunststoffen uiteenvallen, zelfs jaren. Meestal vallen ze uiteen in kleinere stukjes, in plaats van chemische componenten. Dit soort producten zou het plasticprobleem kunnen verergeren.
Glazen flessen Glas is gemaakt van silica, dat een grotere ecologische voetafdruk heeft dan drankkartons en aluminium blikjes. Hoewel hun recyclingpercentage hoger is, is het een complexe kwestie: de productie van glas kan leiden tot landverslechtering en verlies aan biodiversiteit.
De toekomst? Onderzoekers hebben gekeken naar bacteriën en schimmels die zich voeden met plastic en deze materialen kunnen afbreken. Er is een soort keverlarve gevonden die polystyreen verslindt. Ook worden chemische behandelingen en waterfiltratiesystemen onderzocht die microplastics kunnen verwijderen.
Veelvoorkomende mythen over klimaatverandering Als je ooit getuige bent geweest van een discussie over klimaatverandering, persoonlijk of online, ben je waarschijnlijk een aantal dubieuze argumenten tegengekomen over wat de wetenschap zegt. Hoewel sommige van deze beweringen misschien logisch klinken, zijn ze feitelijk misleidend of volkomen onnauwkeurig. Deze onderwerpen zijn keer op keer grondig bestudeerd en ontkracht door klimaatwetenschappers, maar de mythen blijven bestaan.
Nieuwsgierig? LEES verder voor enkele van de grootste mythen over klimaatverandering.
Mythe: klimaatverandering bestaat niet Naarmate de gemiddelde oppervlaktetemperatuur van de aarde stijgt, worden extreme weersomstandigheden waarschijnlijker en ernstiger.
Mythe: klimaatverandering bestaat niet En hoe graag we het ook zouden willen, de klimaatverandering zal blijven bestaan totdat we er iets zinvols aan doen.
Mythe: Het klimaat op aarde is altijd veranderd Het is waar dat het klimaat in de loop van de 4,5 miljard jaar durende geschiedenis van de aarde veel is veranderd. De veranderingen die normaal gesproken over miljoenen jaren zouden plaatsvinden, vinden nu echter over tientallen jaren in een veel sneller tempo plaats.
Mythe: Het klimaat op aarde is altijd veranderd Deze snelle opwarming komt overeen met het kooldioxidegehalte in de atmosfeer, dat sinds de industriële revolutie is toegenomen. Dus als mensen tegenwoordig over klimaatverandering praten, bedoelen ze antropogene (door de mens veroorzaakte) klimaatverandering.
Mythe: we kunnen ons eenvoudigweg aanpassen aan de klimaatverandering Hoewel het waar is dat de soort op aarde zich kan aanpassen aan extreme veranderingen, is er helaas geen sprake van een snelle evolutie.
Mythe: we kunnen ons eenvoudigweg aanpassen aan de klimaatverandering De trieste realiteit is dat in plaats van dat soorten zich aanpassen aan de veranderende omgeving, we getuige zijn van een van de grootste massale uitstervingen in de hele geschiedenis.
Mythe: klimaatverandering is slechts een complot om geld te verdienen Veel ontkenners van de klimaatverandering zullen helaas vasthouden aan deze mythe. In 2018, kort nadat het tweede deel van de National Climate Assessment uitkwam, beweerde Rick Santorum, een voormalige Republikeinse senator, dat klimaatwetenschappers ‘gedreven worden door het geld dat ze ontvangen’.
Mythe: klimaatverandering is slechts een complot om geld te verdienen Om deze samenzwering waar te maken, zouden tienduizenden wetenschappers over de hele wereld moeten worden afbetaald, wat helemaal niet realistisch is.
Mythe: hernieuwbare energie is weersafhankelijk en minder betrouwbaar dan fossiele brandstoffen Hernieuwbare energiebronnen, zoals zonne- en windparken, worden door ontkenners van de klimaatverandering vaak beschouwd als onbetrouwbaar en een onwerkelijk alternatief voor fossiele brandstoffen.
Mythe: hernieuwbare energie is weersafhankelijk en minder betrouwbaar dan fossiele brandstoffen Hoewel het waar is dat windparken op een windstille dag geen stroom produceren, is dit niet de manier waarop een windpark optimaal functioneert. Hetzelfde geldt voor een zonnepark op een bewolkte dag. Er zijn verschillende technologieën die deze energie kunnen benutten en opslaan, zodat deze kan worden ingezet tijdens minder optimale weersomstandigheden.
Mythe: het is nog steeds koud, dus de klimaatverandering moet een hoax zijn Hoe wetenschappelijk onjuist deze bewering ook is, het is helaas een veelvoorkomend argument van ontkenners van de klimaatverandering.
Mythe: het is nog steeds koud, dus de klimaatverandering moet een hoax zijn Zoals eerder vermeld, beïnvloedt klimaatverandering het weer op een grote verscheidenheid aan manieren. Dit betekent over het algemeen zwaarder weer, waardoor het zelfs kouder kan worden dan normaal.
Mythe: het bouwen van windturbines kost meer energie dan het kan produceren Een andere mythe is dat er meer energie nodig is om hernieuwbare bronnen, zoals windturbines, te bouwen dan ze tijdens hun operationele levensduur kunnen produceren.
Mythe: het bouwen van windturbines kost meer energie dan het kan produceren Uit meerdere onderzoeken blijkt echter dat het gemiddeld slechts zes maanden duurt voordat een windturbine de hoeveelheid energie die is gebruikt om hem te bouwen, heeft "terugbetaald".
Mythe: wetenschappers zijn het oneens over de oorzaak van klimaatverandering In tegenstelling tot wat vaak wordt gedacht, zijn de meeste wetenschappers het er niet mee eens dat klimaatverandering plaatsvindt en dat deze door mensen wordt veroorzaakt.
Mythe: wetenschappers zijn het oneens over de oorzaak van klimaatverandering Verschillende analyses gedurende vele jaren hebben zelfs aangetoond dat tussen de 90% en 100% van de publicerende klimaatwetenschappers het erover eens zijn dat mensen de belangrijkste oorzaak zijn van de opwarming van de aarde.
Mythe: klimaatverandering is een toekomstig probleem In de jaren zeventig, toen de klimaatverandering wetenschappelijk relevant werd, werd er getheoretiseerd dat de gevolgen ervan pas na een paar eeuwen een grote impact op ons zouden hebben. Tegenwoordig zien we echter al de verwoestende gevolgen van de klimaatverandering.
Mythe: klimaatverandering is een toekomstig probleem Van de stijgende zeespiegel tot de stijgende temperaturen: de door de mens veroorzaakte klimaatverandering is de grootste milieucrisis van onze tijd. En het is nu al een bedreiging voor ons.
Mythe: planten verbruiken koolstofdioxide, dus ze zullen het probleem voor ons oplossen Hoewel het waar is dat planten koolstofdioxide (CO2) nodig hebben om te leven, is het probleem dat ze maar een beperkte hoeveelheid koolstofdioxide kunnen opnemen, en deze hoeveelheid wordt steeds minder. Ze hebben CO2 nodig om het fotosyntheseproces te doorlopen, waardoor de energie ontstaat die ze nodig hebben om te groeien.
Mythe: planten verbruiken koolstofdioxide, dus ze zullen het probleem voor ons oplossen Naarmate we meer bomen kappen en planten opruimen voor landbouwdoeleinden, verminderen we de hoeveelheid CO2 die kan worden opgenomen. Dit verergert de klimaatverandering rechtstreeks en heeft ernstige gevolgen.
Mythe: het zijn de veranderingen in de zon die ervoor zorgen dat de aarde opwarmt, niet wij De zon geeft leven aan onze planeet en houdt haar warm genoeg zodat wij allemaal kunnen overleven. Het beïnvloedt ook het klimaat op aarde, maar niet zoveel als sommigen zouden denken.
Mythe: het zijn de veranderingen in de zon die ervoor zorgen dat de aarde opwarmt, niet wij De realiteit is dat de opwarming van de aarde die we de afgelopen decennia hebben gezien te snel en drastisch is om te worden gekoppeld aan veranderingen in de baan van de aarde, en te groot om te worden veroorzaakt door zonneactiviteit.
Mythe: China is het enige land dat verantwoordelijk is voor de klimaatverandering Hoewel het waar is dat China een van de grootste uitstoters van broeikasgassen is, zijn ze ook een van de grootste investeerders in hernieuwbare energie. De toename van de investeringen is een reactie op de groei van groene bedrijven en de noodzaak om de luchtvervuiling op te ruimen.
Mythe: China is het enige land dat verantwoordelijk is voor de klimaatverandering Uiteindelijk is klimaatverandering een mondiaal probleem en hebben we allemaal de verantwoordelijkheid om de klimaatcrisis het hoofd te bieden.
Mythe: het temperatuurrecord is vervalst of onbetrouwbaar Dit is een veelgehoord gespreksonderwerp onder sceptici over klimaatverandering, wat plausibel zou kunnen zijn als de wetenschap zich op slechts één of twee gegevens zou baseren.
Mythe: het temperatuurrecord is vervalst of onbetrouwbaar Er zijn echter veel verschillende temperatuurregistraties geproduceerd door verschillende onafhankelijke instanties over de hele wereld, en hun gegevens zijn feitelijk consistent met elkaar.
Mythe: klimaatverandering zal mij niet beïnvloeden Dit is een van de grootste misvattingen onder klimaatsceptici. Velen geloven dat het ook andere delen van de wereld kan treffen en dat ook dieren getroffen zullen worden, maar dat ze nog vele jaren veilig zullen blijven.
Mythe: klimaatverandering zal mij niet beïnvloeden Helaas voor hen is dat helemaal niet het geval. Nu de mondiale temperaturen stijgen, zal het weer heftiger worden, en we zijn hier nu al getuige van in alle uithoeken van de wereld.
Mythe: klimaatverandering kan niet worden gestopt; het is te laat Hoewel het duidelijk is dat we bijna geen tijd meer hebben, is er nog steeds een beperkte kans om dit decennium beleid te implementeren en actie te ondernemen om ervoor te zorgen dat we de ergste gevolgen van de klimaatverandering vermijden.
Mythe: klimaatverandering kan niet worden gestopt; het is te laat Het is nog steeds mogelijk dat de wereld het netto nulpunt bereikt (de uitstoot van broeikasgassen terugdringt) en de opwarming beperkt tot 1,5°C, maar er is dit decennium veel meer actie nodig, vooral van overheden en bedrijven.
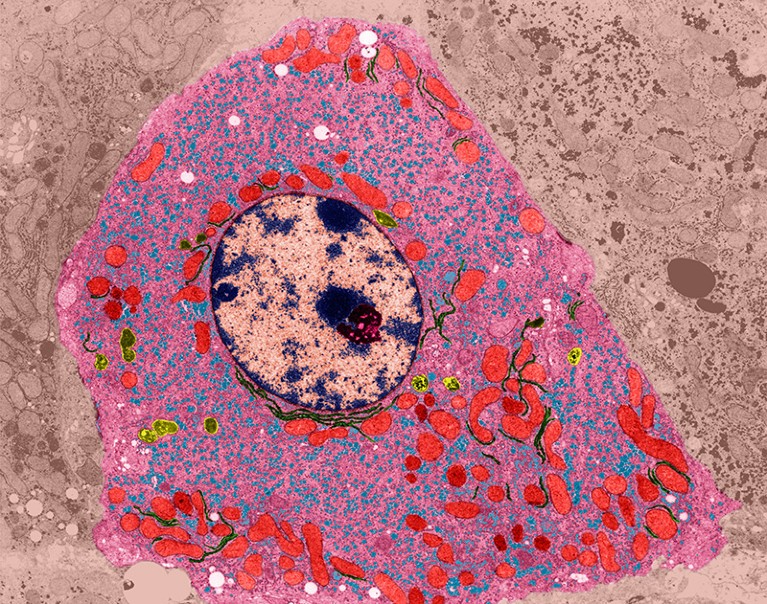
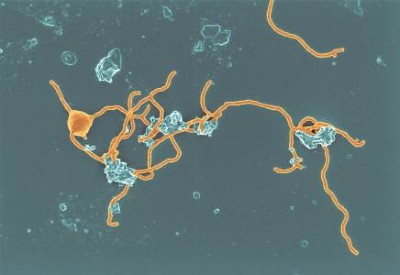
Wetenschappers van een laboratorium in het Franse Marseille hebben gewaarschuwd voor de mogelijkheid van een nieuwe pandemie in de toekomst. Deze zou immers kunnen worden veroorzaakt door een virus dat al meer dan 30.000 jaar bevroren is.
Microben in het noordpoolgebied zouden de oorzaak kunnen zijn, nadat de opwarming van de aarde, de toegenomen menselijke activiteit en de aanwezigheid van schepen in de regio het ontdooi- en smeltproces versnellen.
Volgens de onderzoekers is de kans groot dat deze en andere virussen, als het ontdooiproces doorgaat, zich vrij zullen verspreiden en uiteindelijk nieuwe ziekten veroorzaken.
Dit ‘zombievirus’ werd door laboratoriumonderzoekers ontdekt in een laag Siberische permafrost die duizenden jaren bevroren was in het noordwesten van Siberië.
Het nieuws werd in The Guardian becommentarieerd door de Nederlandse viroloog Marion Koopmans, die beweerde dat “we niet weten welk virus zich in de permafrost bevindt. Maar ik denk dat er een reëel risico bestaat dat er één virus is dat een epidemie kan veroorzaken, bijvoorbeeld een oude vorm van polio. We moeten aannemen dat zoiets zou kunnen gebeuren”, waarschuwde ze.
(Tagtik/Source: The Guardian/Illustration: Pixabay)
Hoe het klimaat op aarde verder ontspoorde in 2023: zes opvallende vaststellingen over een uitzonderlijk weerjaar
Hoe het klimaat op aarde verder ontspoorde in 2023: zes opvallende vaststellingen over een uitzonderlijk weerjaar
Artikel van Michaël Torfs
Al lang op voorhand konden we met zekerheid zeggen dat 2023 het warmste jaar ooit zou worden. Als een wielrenner die zo'n grote voorsprong heeft dat hij nog lang voor de aankomst al zegezeker is. Alleen is het in dit geval iets wat we liever niet zien.
"We hebben heel wat extreme situaties meegemaakt in 2023", weet klimatoloog Niels Souverijns (VITO). "De vingerafdruk van de klimaatopwarming wordt steeds duidelijker. Het is iets wat we misschien normaal gaan vinden, maar we moeten ons heel goed realiseren dat dit niet normaal is."
"We wisten dat dit rapport geen goed nieuws zou brengen", zegt Mauro Facchini van het klimaatobservatorium van de Europese Unie daarover. "De EU wil tegen 2030 55% minder broeikasgassen uitstoten. We weten wat ons te doen staat."
Als het gaat over de marges van het klimaat wereldwijd, rekenen we doorgaans met tienden van een graad of minder. In 2023 werden er verschillende nieuwe mijlpalen gezet met behoorlijk grote marges. In het jaarrapport staan heel wat details over 2023, dat op klimaatvlak een heel bewogen jaar was mede door het weerfenomeen El Niño. Wij pikken er 6 voor je uit.
1. Net geen anderhalve graad extra (maar het komt eraan)
2023 bleek uiteindelijk 1,48 graden Celsius warmer dan het gemiddelde van 1850-1900, de referentieperiode voor de VN-klimaatconferentie en het VN-klimaatpanel IPCC. Het was 0,17 graden warmer dan het vorige warmste jaar uit onze moderne geschiedenis, 2016.
Vorig jaar was het 12 maanden na elkaar dus net geen anderhalve graad warmer, maar eind januari of eind februari kunnen we wél aan 12 opeenvolgende maanden zitten die de drempel overschrijden.
Dat ligt symbolisch gevoelig, want de wereldleiders houden op de klimaatconferenties nog altijd vast aan een beperking van de opwarming tot die anderhalve graad - het gaat dan over een structurele opwarming op langere termijn (over verschillende jaren).
Door de opwarming onder anderhalve graad te houden, kunnen we de ergste gevolgen van de klimaatverandering proberen te voorkomen.
2. Twee dagen naar 2 graden extra (en dat is ongezien)
Vorig jaar was het op ongeveer de helft van de dagen minstens anderhalve graad warmer. Midden november waren er 2 dagen waarop het meer dan 2 graden warmer was. Dat is nog nooit eerder gebeurd en opnieuw een alarmsignaal.
Hoe meer de planeet opwarmt, hoe groter de weersextremen kunnen zijn - denk aan hevige regen, stormweer, of grote hitte met lange droge periodes.
Het hele jaar door kregen we berichten over hittegolven, overstromingen, droogtes en bosbranden uit verschillende hoeken. In Canada waren er grootscheepse en aanhoudende bosbranden. De CO₂-uitstoot door bosbranden lag vorig jaar 30 procent hoger dan het jaar daarvoor. Dat komt onder meer door de ongeziene natuurbranden in Canada waar het "worstcasescenario overtroffen werd".
Bovenstaande grafiek toont hoeveel warmer elke dag in 2023 verliep tegenover de pre-industriële referentieperiode. Tijdens de tweede helft van het jaar zaten we gemiddeld bijna constant boven de anderhalve graad (zie de iets donkerder band in het midden). In november waren er zelfs twee pieken boven de 2 graden.
"Die anderhalve graad die we in 2023 hadden en die enkele dagen met 2 graden zijn symbolische grenzen, omdat het drempels zijn die zijn afgesproken in het klimaatakkoord van Parijs, met de bedoeling om daaronder te blijven", zegt klimatoloog Niels Souverijns.
3. Tweede jaarhelft brak alle records, maand na maand (en dat kan blijven duren)
Vooral de tweede helft van het jaar brak alle records, mede door het losbreken van het weerfenomeen El Niño. Vanaf juni werd er elke maand opnieuw een warmterecord gevestigd.
De maanden september en oktober sprongen eruit met een bijzonder grote afwijking. Klimatoloog Wim Thiery (VUB) maakte voor oktober (+0,40 graden warmer dan warmste oktober voorheen) de vergelijking met de sprint in de atletiek, "alsof het wereldrecord op de 100 meter ineens met een volle seconde gebroken zou worden".
De voorbije maand december was ook weer de warmste ooit gemeten. De maand bleek maar liefst 1,78 graden Celsius warmer dan een gemiddelde december 150 jaar geleden.
Klimatologen verwachten dat El Niño zich nog zal doorzetten tot het einde van de lente, waardoor 2024 nog warmer zou kunnen uitvallen dan het voorbije jaar en een nieuw record zou kunnen vestigen. "2024 gaat zeker geen afkoeling kennen tegenover vorig jaar. De trend gaat zich doorzetten, en we mogen dus nog meer extremen en nog meer records verwachten", schetst Souverijns.
4. Oceanen waren nooit warmer (en dat heeft grote gevolgen)
Grote delen van de oceanen waren nooit warmer dan vorig jaar. Ook dat is een teken van de verdere opwarming. "We zien al een paar jaar een trend naar warmere oceanen, en dit jaar heeft het weerfenomeen El Niño (waarbij een deel van de Stille Oceaan warmer is dan anders, red.) er zeker niet bij geholpen", zegt Souverijns.
Oceanen slaan een groot deel van de extra warmte van de klimaatopwarming op, maar dat blijft niet zonder gevolgen. Boven de oceaan kunnen intense stormdepressies ontstaan. Warmer zeewater kan ook een intensere regenval veroorzaken, zoals vorige week nog bleek tijdens de overstromingen in ons land.
Dat het zeewater nooit zo warm was, bleek ook uit de verschillende mariene hittegolven in o.a. de Middellandse Zee, de Golf van Mexico en het Caraïbische gebied, de Indische Oceaan, het noorden van de Stille Oceaan en het noordelijke deel van Atlantische Oceaan.
"In Libië hadden we zware schade als gevolg van de "medicane" (de plaatselijke cycloon boven de Middellandse Zee, gevoed door het ware zeewater daar, red.) en bij ons hadden we de zware neerslaghoeveelheden van de voorbije twee maanden", zegt Souverijns.
Uit een studie in Nature bleek onlangs dat het aantal mensen dat is blootgesteld aan tropische cyclonen, zowat verdubbeld is tussen 2002 en 2019 (van 408 miljoen naar 792 miljoen). Dat komt voor het grootste deel door de klimaatverandering. Het gaat om 6 tot 12 procent van de wereldbevolking, onder meer in China, Japan, de Filipijnen, Taiwan en de VS.
De Duitse herverzekeraar Munich Re liet vandaag weten dat de schade door onweders in de Verenigde Staten vorig jaar op 66 miljard dollar ligt (ongeveer 60 miljard euro). In Europa ging het om 10 miljard dollar. Telkens gaat het om een absoluut record.
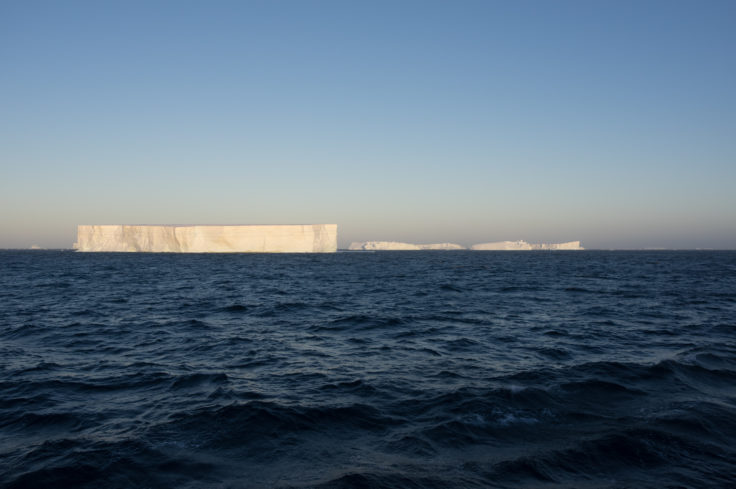
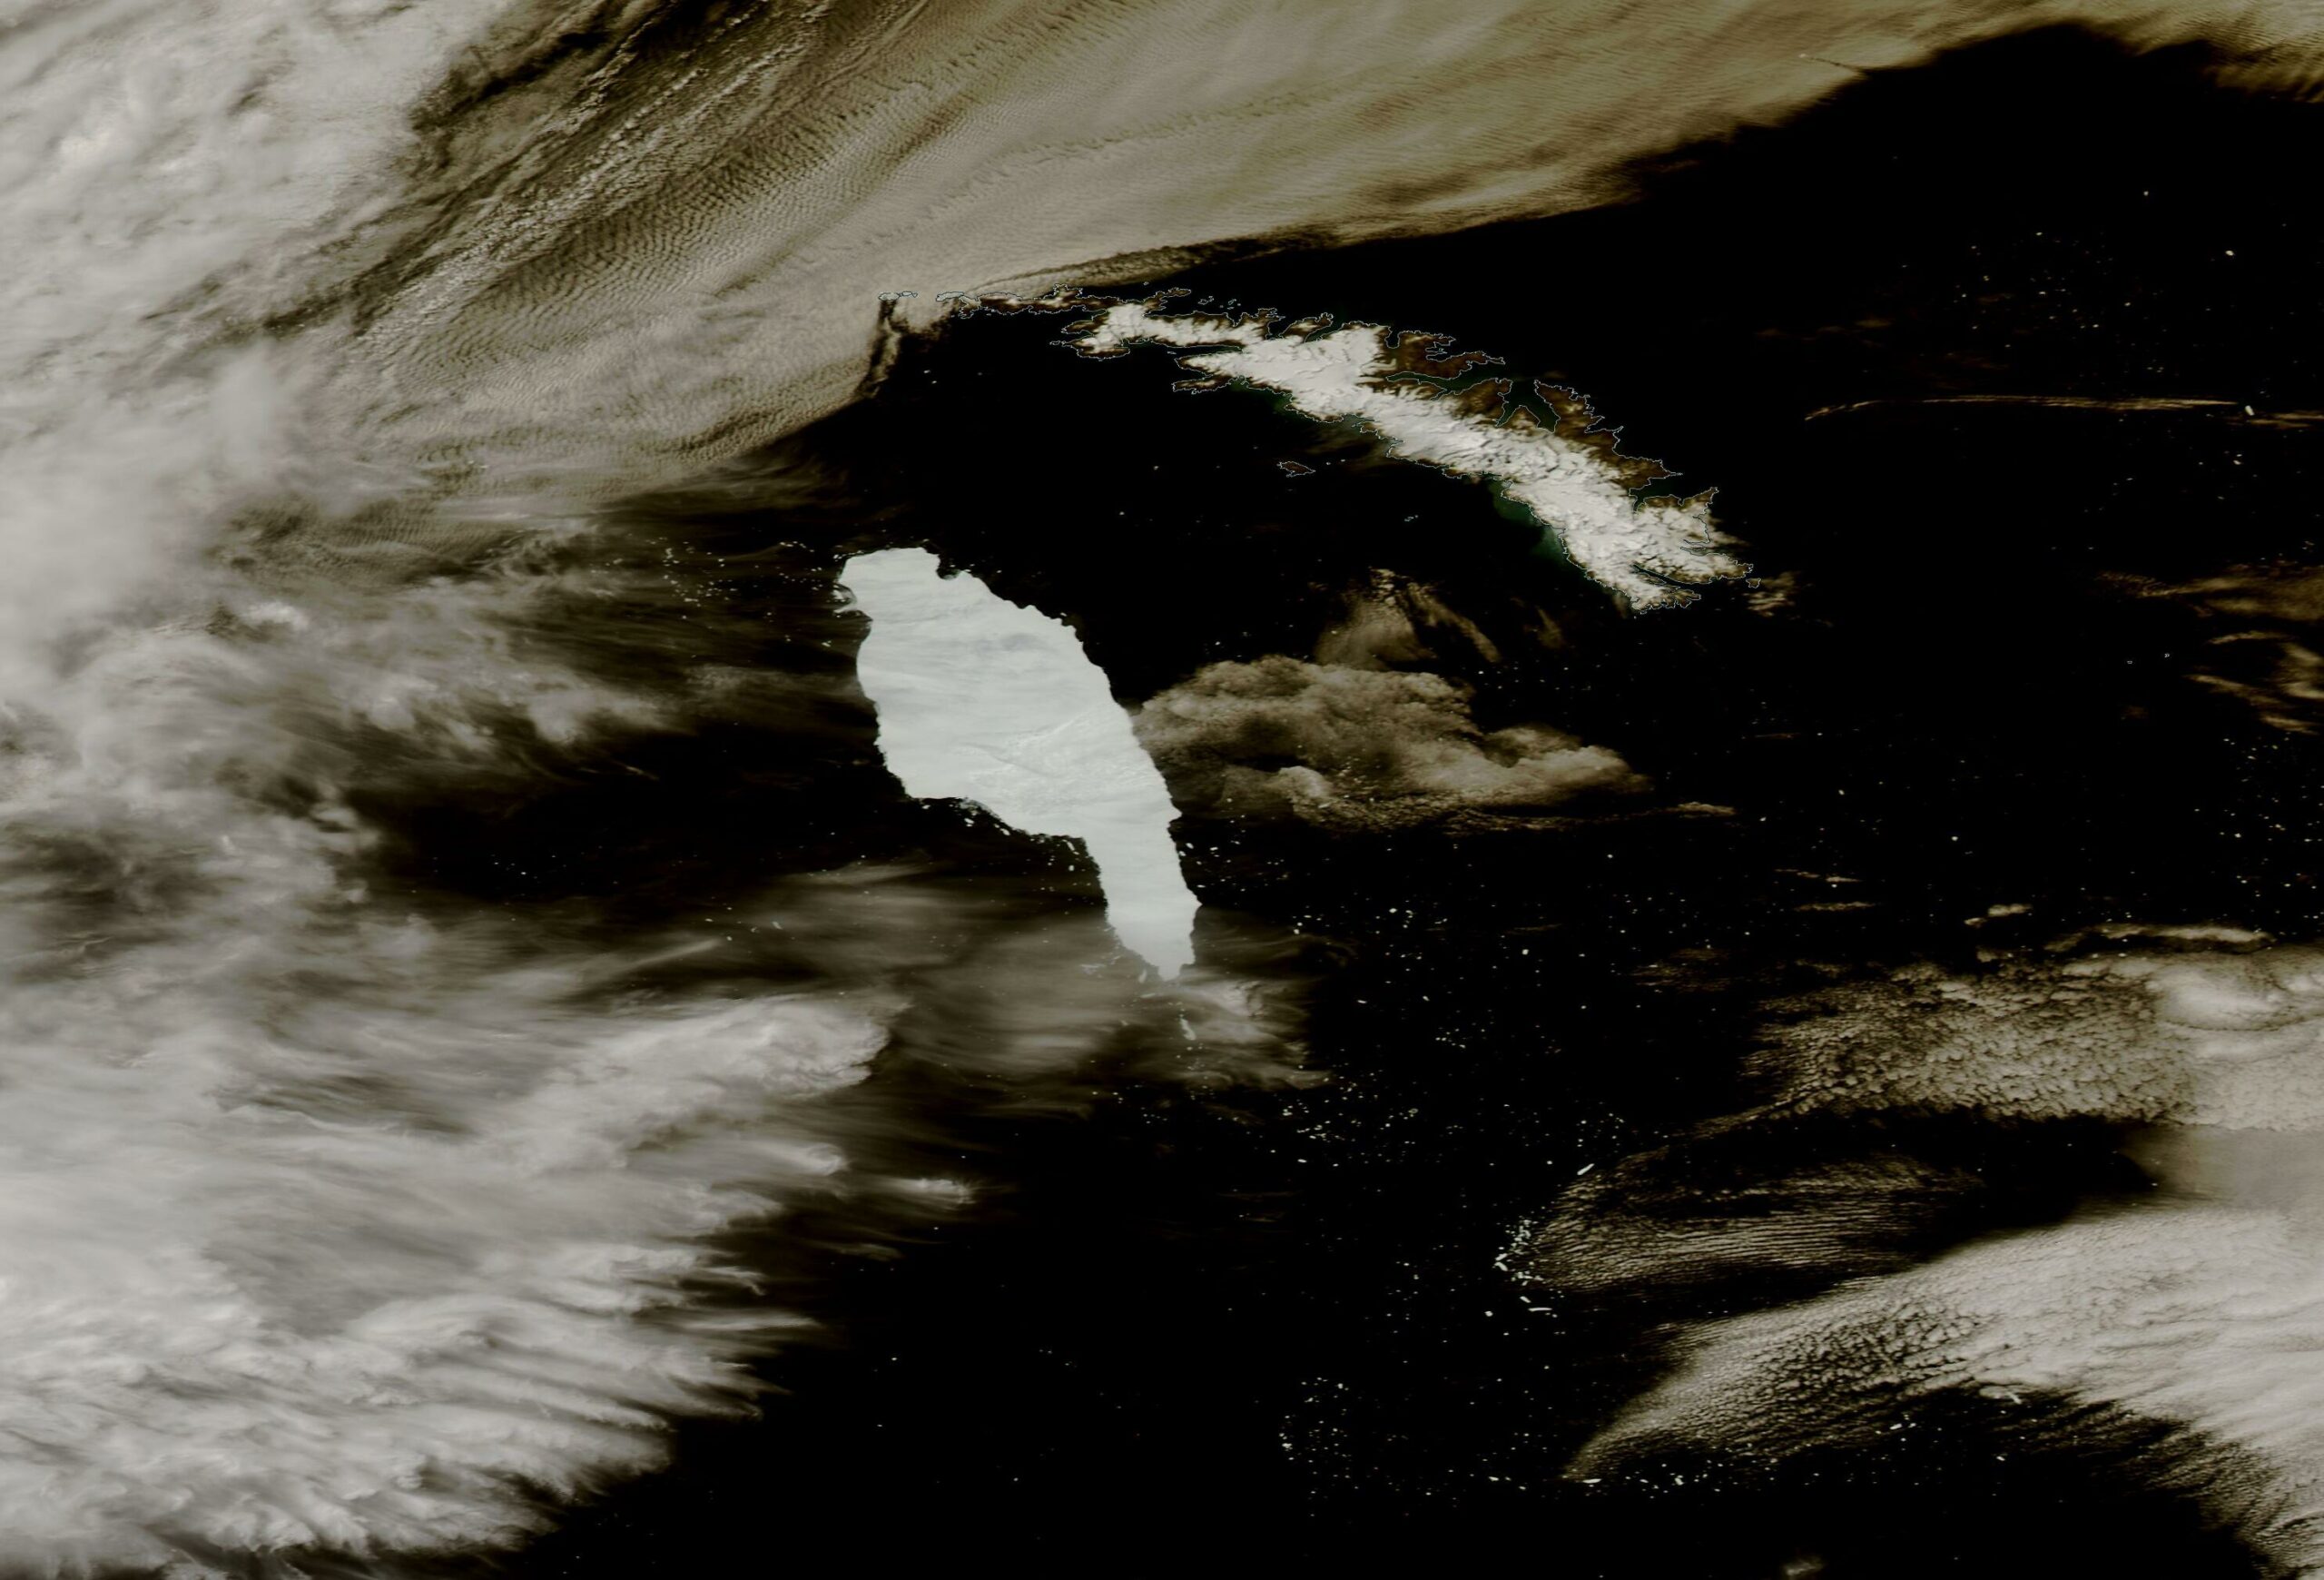
5. Nooit was het zee-ijs op Antarctica er zo slecht aan toe
De gevolgen van de opwarming zien we ook in de omvang van het zee-ijs aan de Zuidpool. Tijdens 8 verschillende maanden bereikte de omvang van het zee-ijs een laagterecord voor de tijd van het jaar.
De CO₂ blijft zich opstapelen in de lucht door de hoge menselijke uitstoot, en is nu naar 419 ppm (deeltjes per miljoen) geklommen, wat de steile klim van de vorige decennia bevestigt.
Voor methaan kwamen er 11 ppb (deeltjes per miljard) bij tot 1.902 ppb. Die stijging is hoog maar ligt iets lager dan de voorbije jaren. Methaan is een sterker broeikasgas dan CO₂, maar CO₂ blijft dan weer veel langer hangen en doorwerken, tot honderden jaren en meer.
De broeikasgassen: hoogste waarde in 800.000 / 2 miljoen jaar
Ook de concentratie van broeikasgassen in de wereldwijde atmosfeer bleef stijgen. Het gehalte aan CO₂ (koolstofdioxide) steeg verder door met 2,1 ppm (parts per million of deeltjes per miljoen). Het jaargemiddelde voor CO₂ (los van de seizoensvariaties) in de atmosfeer bedraagt nu 417 ppm. Dat is het hoogste niveau ooit gemeten door de mens en het is volgens Copernicus het hoogste in ruim 2 miljoen jaar tijd. De stijging tijdens het voorbije jaar ligt ongeveer op de gemiddelde koers, terwijl ze eigenlijk zou moeten afnemen als we de klimaatopwarming willen afremmen.
Onderstaande balkjes tonen hoe de gemiddelde jaartemperatuur op aarde in de voorbije 60 jaar afweek van het gemiddelde tussen 1850 en 1900 - de graad van opwarming valt op de verticale as aan de linkerkant af te lezen. Daar waar we rond het jaar 2000 nog aan een opwarming zaten van 0,6 tot 0,8 graden, was dat vorig jaar dus ongeveer 1,2 graden. (data Copernicus)
Noot:als we het hebben over de klimaatopwarming, kijken we naar een periode van 20 tot 30 jaar, omdat klimaat nu eenmaal een foto is van de langere termijn. Daarom spreken we van een klimaatopwarming van 1,1 graden Celsius momenteel, hoewel de realiteit van de voorbije vijf jaar toont dat we (voor die vijf jaar gemiddeld) al aan ongeveer 1,2 graden extra zitten.
What is the mark of a genius? The ability to reach a solution through an unforeseen shortcut instead of a random walk or an elaborate effort.
In the late 1940s, the brilliant physicists Shin’ichirō Tomonaga and Julian Schwinger offered an operator method for calculating quantum electrodynamics, which was entirely different from Richard Feynman’s diagrammatic method. The two approaches appeared very different, until a 25-year old physicist, Freeman Dyson, had an Eureka moment and demonstrated in a 1949 paper that they are equivalent. The circumstances were unexpected.
In the spring of 1948, Dyson took a cross-country road trip with Feynman. Upon his return, Dyson went to Ann Arbor to spend six weeks with Schwinger. Subsequently, he left Michigan for another cross-country bus trip. Dyson referred to a “flash of illumination on the Greyhound bus,” where everything fell into place. He saw the equivalence of the two competing formulations that had evaded both Feynman and Schwinger.
I often tell my students and postdocs that scientific insights are not necessarily the product of hard work. Take a vacation … go to the movies … enjoy music. If at the end of it all, you’ll return with a brilliant solution to a problem that others were struggling with, your contribution is invaluable. Your intelligence is measured by the originality of your intellectual discoveries and not by the number of likes you get on social media.
What makes human intelligence so unique relative to animals? It is in its ability to promote knowledge exponentially fast. Natural selection is often set up through gradual zero-sum games in an environment that offers limited resources. Animals with better motor skills maintain territorial control more effectively than their competitors. This perspective changed drastically over the past century of human history. Modern science and technology now offer an infinite-sum game with unlimited resources. Whereas natural evolution was limited to Earth, humans launched spacecraft towards new domains of real estate within the solar system and beyond.
Human intelligence allows exponential growth of technological capabilities. Moore’s Law for the miniaturization of semiconductors applies to a broader range of technological capabilities, including 3D printing, drones, robotics, artificial intelligence and synthetic biology.
Without intelligence, unplanned progress is limited to random walks. For example, mutations sample by chance alternative designs of biological systems. Science is made efficient by design through constructive cooperation, as summarized in a 1675 letter by Isaac Newton to Robert Hooke: “if I have seen further, it is by standing on the shoulders of giants.” Sharing scientific and technological knowledge among individuals and groups makes the growth rate of knowledge proportional to the amount of existing knowledge. When the rate scales with the amount, growth is exponential.
Communication via language and mathematics is key to the exponential evolution of science and technology. Sharing information promotes its growth at a rate that is proportional to what is already known by the community.
It is reasonable to imagine that these traits are universal and likely also apply to alien species on exoplanets. If extraterrestrial gadgets can reach Earth, then the senders probably communicate with each other through a language. In other words: technological aliens communicate!
And if their technological growth is exponential as is ours, they could be far more superior if their technological age exceeds ours. When we encounter their gadgets we might be filled with religious awe, like Moses witnessing the burning bush which was never consumed and concluding that it was manufactured by a superhuman entity.
Humans exceeded the evolutionary level of chimpanzees not by developing better motor skills, but by developing rockets that can reach the Moon and Mars. Given this perspective, it is surprising that some of my colleagues insist that interstellar meteors must be stones. I refer to this perspective as “the stone age of science.”
Imagining what might lie beyond the solar system is a mark of intelligence. We know that 83% of the cosmic matter is not comprised of stones, but an unknown substance labeled “dark matter”. Our ability to consider alternatives to the familiar enables growth in our scientific knowledge. Those who insist on past knowledge will remain ignorant in the same way that chimpanzees never imagined landing on the Moon and non-avian dinosaurs never looked through telescopes in anticipation of a looming catastrophe from an asteroid impact.
Extending our ventures to interstellar space beyond the boundaries of the Solar system would be the next mark of human intelligence and ingenuity. Enrico Fermi asked: “where is everybody?” The answer may arrive as soon as we exit the Oort Cloud to interstellar space: “Welcome to the club of intelligent civilizations whose knowledge grows exponentially.”
Avi Loeb is the head of the Galileo Project, founding director of Harvard University’s – Black Hole Initiative, director of the Institute for Theory and Computation at the Harvard-Smithsonian Center for Astrophysics, and the former chair of the astronomy department at Harvard University (2011-2020). He chairs the advisory board for the Breakthrough Starshot project, and is a former member of the President’s Council of Advisors onScience and Technology and a former chair of the Board on Physics and Astronomy of the National Academies. He is the bestselling author of “Extraterrestrial:The First Sign of Intelligent Life Beyond Earth” and a co-author of the textbook “Life in the Cosmos”, both published in 2021. His new book, titled “Interstellar”, was published in August 2023.
Scientists described a slew of new species this past year, including an electric blue tarantula, two pygmy squid, a silent frog, and some thumb-sized chameleons.
Experts estimate less than 20% of Earth’s species have been documented by Western science.
Although a species may be new to science, it may already be well known to local and Indigenous people and have a common name.
Many new species of plants, fungi, and animals are assessed as Vulnerable or Critically Endangered with extinction as soon as they are found, and many species may go extinct before they are named, experts say.
Scientists named hundreds of new to science species this year, including an electric blue tarantula, two pygmy squids, a silent frog, and some thumb-sized chameleons. These newly uncovered creatures give us just a glimpse into the immense biodiversity yet to be found across the planet.
“I think most people believe that we know most species on Earth … but in the best-case scenario, we know 20% of Earth’s species,” Mario Moura, a professor at the Federal University of Paraíba in Brazil, told Mongabay in a March 2021 interview.
Experts estimate only 10-20% of Earth’s species have been documented by Western science.
This year, researchers at the California Academy of Sciences described 153 new plant, animal and fungi species. Since 2020 alone, researchers have classified 100,000 new plant and fungus species. However, at this pace, researchers say documenting all life could take centuries, and many species may go extinct before they’re even named.
More than a million plant and animal species are threatened with extinction, suggests the Intergovernmental Science-Policy Platform on Biodiversity and Ecosystem Services (IPBES). Many new species of plants, fungi, and animals are assessed as vulnerable or critically endangered with extinction as soon as they’re found.
“There is something immensely unethical and troubling about humans driving species extinct without ever even having appreciated their existence and given them consideration,” Walter Jetz, a professor of ecology and evolutionary biology at Yale University, told Mongabay,
It’s important to note that although a species may be newly described by science, Indigenous people often know about species long before they’re “discovered” by Western science.
“Many species that are new to science are already known and used by people in the region of origin — people who have been their primary custodians and often hold unparalleled local knowledge,” writes Alexandre Antonelli, director of science at Royal Botanic Gardens, Kew.
Here’s a look at our top new-to-science species from 2023
Nanostructures on the tarantula’s hairs produce an iridescent effect. Image courtesy of Yuranan Nanthaisong.
A new electric-blue tarantula species has been described by scientists in Thailand, making it the first known tarantula species from Thai mangroves. The spider’s vivid blue coloration is created not by pigments but by nanostructures on the tarantula’s hairs that manipulate light and produce an iridescent effect.
Researchers from Khon Kaen University and wildlife YouTuber JoCho Sippawa found these vibrant blue tarantulas in the muddy conditions of Phang Nga province’s mangrove forest. The researchers have raised concerns about the tarantulas’ mangrove habitats being cleared for oil palm cultivation.
Scientists have just described six new species of thumb-sized chameleon in the Eastern Arc Mountains. Image courtesy of Michele Menegon.
Six new species of tiny, threatened pygmy chameleons have been discovered in Tanzania’s Eastern Arc Mountains, a biodiversity hotspot where rapid deforestation threatens endemic wildlife. The chameleons, which can fit on a thumb, reflect the exceptional yet fragile diversity of the mountains’ isolated forests that scientists are still documenting.
Agricultural expansion driven by population growth and government initiatives to increase food production continue to drive montane forest loss at an alarming rate, shrinking the habitat these new chameleon species depend on. While some forests have been upgraded to higher protection status recently, lack of enforcement and resources enable ongoing encroachment.
Conservationists say they hope flagship species like the colorful chameleons can boost the global profile of the Eastern Arc Mountains to promote tourism and secure funding for protection programs involving local communities.
Scientists have described a new-to-science snake species from Peru’s Otishi National Park and named it after the actor Harrison Ford for his conservation advocacy. The pale yellowish-brown snake with black blotches was found in high-elevation wetlands and identified using genetic techniques. Satellite data and imagery show several areas of forest loss throughout the park, which appear to have been caused by natural landslides. Still, some bear the hallmarks of human-caused clearing likely linked to coca cultivation and drug trafficking.
A growing number of researchers also argue that species should not be named after people, as such names may perpetuate a negative legacy associated with imperialism and racism.
A female bent-toed gecko, Cyrtodactylus santana. Image courtesy of Chan et al. (2023).
Scientists have described a new species of bent-toed gecko from a remote cave in Timor-Leste. The new species was confirmed through DNA analysis and further examination of collected specimens and is named after the young nation’s first national park, Nino Konis Santana National Park. Timor-Leste, in Southeast Asia’s Wallacea region, has high levels of biodiversity, including numerous endemic species of birds and other animals. Continued research and exploration in Timor-Leste is expected to uncover many more new plant and animal species, possibly from the same cave where the new gecko was found.
Ryukyuan pygmy squid (Idiosepius kijimuna) attached to a blade of seagrass, photographed in the wild. Image courtesy of Brandon Ryan Hannan.
Researchers found two new species of tiny, reddish pygmy squid in the biodiverse coral reefs and seagrass beds near the Japanese island of Okinawa. The Ryukyuan pygmy squid (Idiosepius kijimuna) and Hannan’s Pygmy Squid (Kodama jujutsu), which measure less than 12 millimeters (0.5 inches), are nocturnal and difficult to spot, but were documented through collaboration between scientists and underwater photographers. Their whimsical names connect them to Japanese folktales, matching their elusive nature and coastal forest habitats, which are threatened by climate change and human activity.
A new species of spiny-throated reed frog found Tanzania’s Ukaguru Mountains. Images courtesy of Christoph Liedtke via Lawson et al. (2023).
Scientists have described a new-to-science species of frog from Tanzania’s Ukaguru Mountains with a unique trait: it’s silent. The males of this species have tiny spines on their throats, which may serve as a means of species recognition for the females.
Researchers encountered the species during an expedition in search of another species, the elusive Churamiti maridadi tree toad, which has only been spotted twice in the wild and is feared to be extinct. The Ukaguru Mountains have a high degree of endemism, and describing this new species highlights the vast amount of knowledge still to be gained about this biodiversity-rich area.
Venomius tomhardyi pictured next to an illustration of Tom Hardy’s Venom character. Image courtesy of Rossi et al. (2023). Illustration by Zeeshano0 via Pixabay.
A new genus and species of spider found in Tasmania has been named Venomius tomhardyi after actor Tom Hardy and his Marvel character Venom, due to the distinctive black spots on the spider’s abdomen resembling Venom’s head. The orb-weaving spider belongs to the Araneidae family and builds circular webs to catch prey, but unlike related spiders, it doesn’t have tubercles on its abdomen and creates silk shelters inside tree branches. Researchers found the spider on an expedition across multiple Australian states by researchers who aim to fully document the continent’s spider diversity to aid conservation efforts.
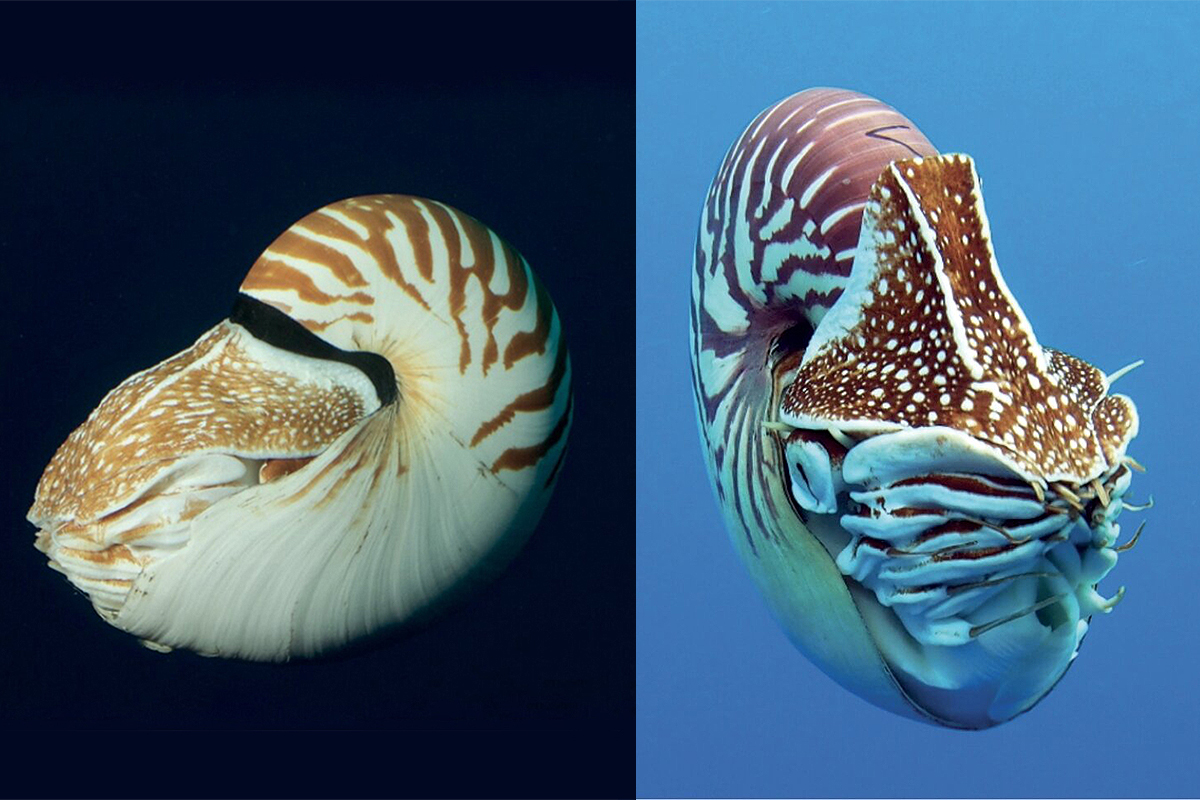
Two of the three new nautilus species identified in the Coral Sea and the South Pacific: Nautilus vitiensis (left) and Nautilus vanuatuensis (right). Images courtesy of Barord et al.
Researchers have described three new species of nautilus found in the Coral Sea and the South Pacific. The three species differ in genetic structure, shell size and coloration, and geographic location. Scientists generally know little about nautiluses but are working to fill in the data gaps to understand how to protect them. Nautiluses are highly threatened by the shell trade, as well as pollution and the impacts of climate change.
The unusual eyes of Uroplatus garamaso help to distinguish it from closely related species of leaf-tailed geckos. Image courtesy of by Jörn Köhler/Hessisches Landesmuseum Darmstadt.
A new species of leaf-tailed gecko, Uroplatus garamaso, has been described from northern Madagascar. Like other geckos in its genus, U. garamaso is a master of camouflage due to skin flaps that allow it to resemble tree bark during the daytime when it presses against branches. At 8-14 centimeters (3-5.5 inches) long, it’s a relatively large gecko for Madagascar. The forest where the gecko lives face threats from logging and fires, endangering U. garamaso which, like many endemic Madagascan species, has a restricted range that makes it vulnerable to habitat loss. More geckos are still being uncovered in Madagascar’s exceptionally biodiverse ecosystems.
The new leafless orchid is named Gastrodia pushparaga due to its coloration and the locality. Image courtesy of Bhathiya Gopallawa.
A new leafless ground orchid found in a lowland wet-zone forest in Sri Lanka has been named after a precious yellow sapphire, a gemstone commonly extracted from the same district. The plant grows in Walankanda, a forest frontier in the island’s intermediate zone with unique characteristics that will likely make these plants susceptible to future climate change impacts earlier than other wet-zone rainforest plants.
Tea plantations are the main driver of forest fragmentation in the area. However, an ambitious project aims to create an ecological land corridor through neglected tea estates, linking the forest where the orchid was first found with another fragmented forest patch.
Only one Río Negro stream tree frog (Hyloscirtus tolkieni) has been found, living in the tropical Andes of Ecuador. Image courtesy of Juan Carlos Sánchez-Nivicela.
A new species of frog has been described from the tropical Andes of Ecuador and named after J.R.R. Tolkien, the author of famous works of fantasy literature. Only one individual of the species was found, within the bounds of Río Negro-Sopladora National Park.
Río Negro-Sopladora was declared a protected area in 2018 and serves as a critical link in the highly diverse Sangay-Podocarpus Corridor, home to many rare and endemic plants and animals. The scientists who described the frog say research and monitoring are urgently needed to better understand this unique species and assess potential threats to its survival, such as invasive species, emerging diseases, and climate change.
The Sibon canopy snake was found in Panama. Image courtesy of Alejandro Arteaga.
Researchers have described five new species of snail-eating snakes from the upper Amazon Rainforest in Ecuador and Colombia and the Chocó-Darién forests of Panama. Three of the new species were named by actor Leonardo DiCaprio, conservationist Brian Sheth, and the NGO Nature and Culture International to raise awareness about the threats these snakes face due to mining and deforestation.
Ecuador and Colombia saw an increase in illegal gold mining along rivers and streams during the COVID-19 pandemic, which may have affected populations of these fragile snakes and has led to conflict and division within communities. Snail-eating snakes are arboreal and depend on wet environments to survive, so deforestation and mining pollution, including illegal gold mining, affect both the snakes and the snails and slugs that they rely on for food.
Microparmarion sallehi. Image courtesy of Menno Schilthuizen et al.
A group of researchers and citizen scientists have identified a new semi-slug species. The so-called “snug,” a snail whose external shell is too small to house its entire body, can be found in the lowland rainforests of northern Borneo Island. The researchers suggest there may be some half a dozen other species from the same genus waiting to be described, highlighting the rich biodiversity of this region.
Banner image: One of the six newly described chameleons from Tanzania, which are already at risk of extinction due to habitat loss, according to researchers. Image courtesy of Michele Menegon.
Liz Kimbrough is a staff writer for Mongabay and holds a Ph.D. in ecology and evolutionary biology from Tulane University, where she studied the microbiomes of trees. View more of her reporting here.
De eenzaamste dingen in het universum Moderne mensen zijn misschien wel het meest bekend met eenzaamheid, omdat is bewezen dat het een steeds vaker voorkomend gevoel is, ondanks onze geavanceerde vormen van verbinding. Maar wij zijn hierin niet de enige. Er zijn veel wezens in het universum die gewend zijn alleen te zijn.
Klik verder om meer te weten te komen over de eenzaamste dingen en wezens in het
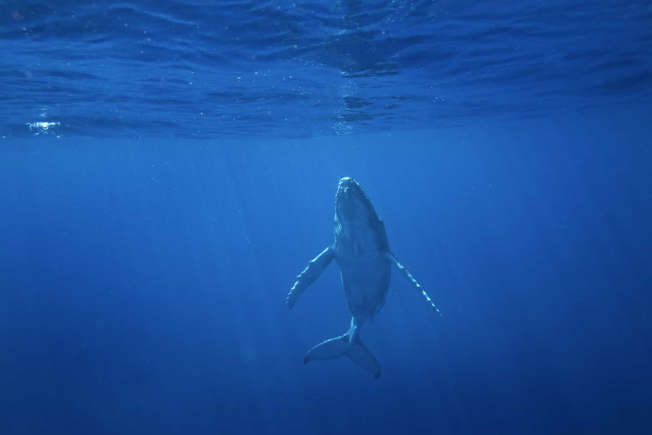
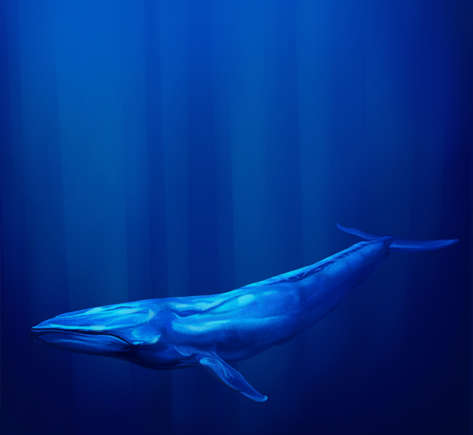
52 Blue Stel je voor dat je de enige persoon ter wereld bent die een bepaalde taal spreekt, en dat niemand je ooit zou kunnen begrijpen. Welkom in de wereld van de eenzaamste walvis ter wereld.
52 Blue Terwijl de meeste walvissen communiceren met een frequentie van 10–39 Hz, roept 52 Blue met een frequentie van 52 Hz, wat betekent dat geen enkele andere walvis hem kan horen of zelfs maar weet dat hij er is.
52 Blue Terwijl hij zonder vrienden of familie door de uitgestrekte oceaan dwaalt, is deze eenzame walvis (ontdekt in de jaren tachtig) zeker een van de eenzaamste wezens ter wereld.
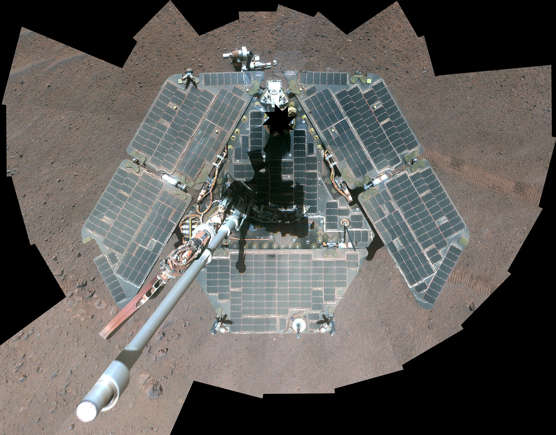
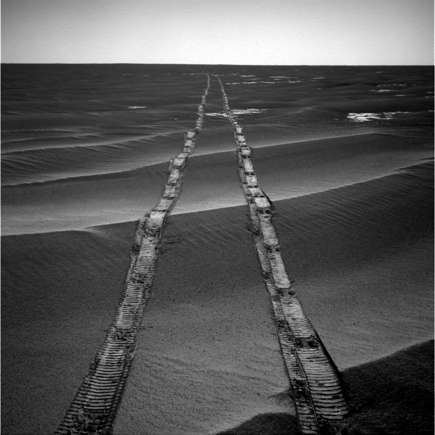
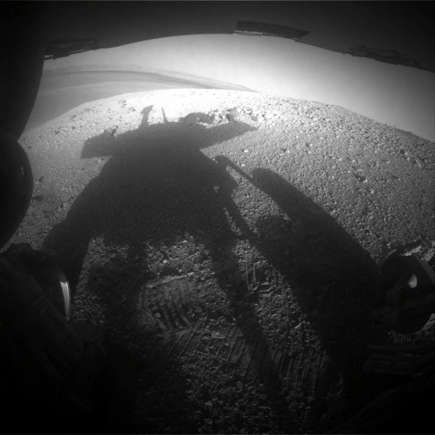
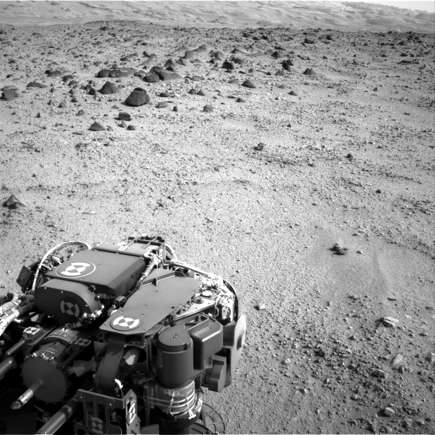
Opportunity, de Mars rover In Februari 2019 kondigde NASA aan dat ze nog een laatste keer zouden proberen contact op te nemen met hun recordbrekende, maar stille Mars-rover, voordat ze hem na vijftien jaar dood zouden verklaren. Dit veelgebruikte apparaat is een van de vieste plekken in huis
Opportunity, de Mars rover De rover die voor het eerst water op Mars bevestigde, is het slachtoffer van een van de meest intense stofstormen in decennia en leeft misschien nog wel, maar NASA kan niet blijven roepen zonder reactie.
Opportunity, de Mars rover “Het is net als een dierbare die vermist is, en je blijft hopen dat ze zullen komen opdagen en dat ze gezond zijn”, zei de projectmanager. “Maar elke dag die voorbijgaat, wordt dat minder, en op een gegeven moment moet je ‘genoeg’ zeggen en verder gaan met je leven.”
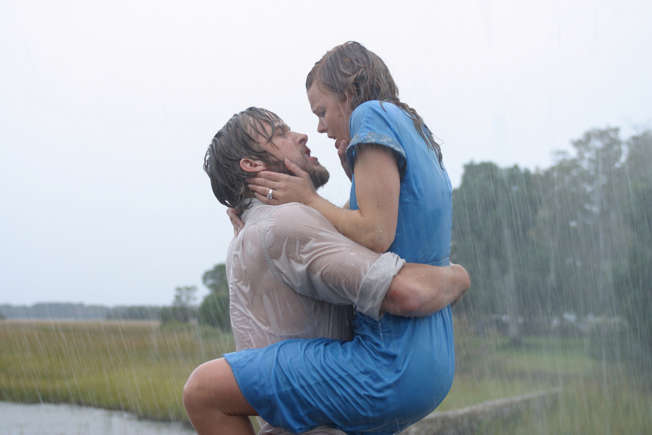
Opportunity, de Mars rover Stel je NASA voor als Noah uit 'The Notebook' en Opportunity als Allie, en hoe eenzaam ze zich allebei voelden omdat ze geen contact met elkaar kregen.
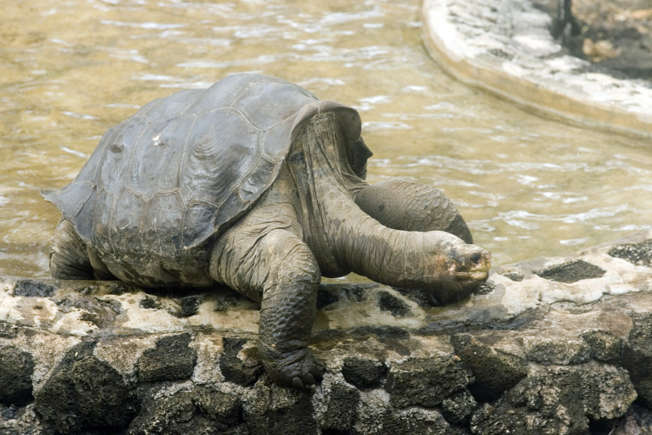
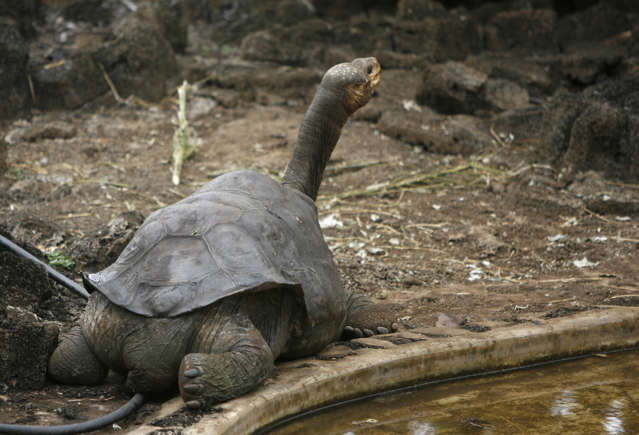
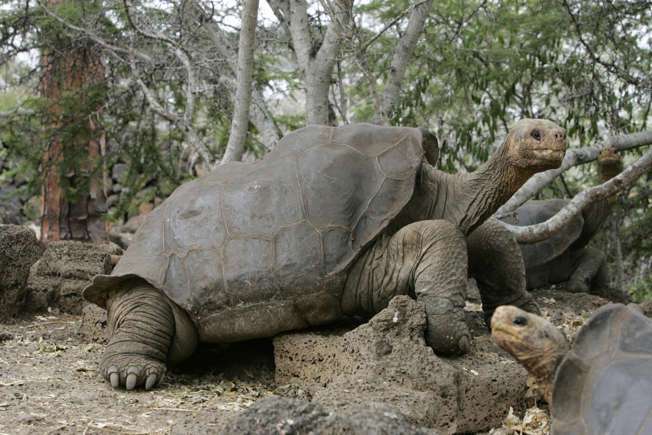
Lonesome George Zijn naam geeft aan hoe eenzaam deze Pinta-eilandschildpad (Chelonoidis abingdoni), afkomstig uit de Galápagos, werkelijk was. Lonesome George was de laatste van zijn soort.
Lonesome George Zijn soort was in de 19e eeuw niet zeldzaam, maar de hele populatie werd door mensen uitgeroeid en tijdens lange zeereizen voor vlees geoogst, omdat ze wel een jaar zonder voedsel of water konden leven.
De ontdekking van George in 1972 was een soort wonder, aangezien men dacht dat zijn soort uitgestorven was. Hij was 60 jaar oud en werd naar een dierentuin gebracht, waar het verhaal alleen maar triester werd.
Lonesome George In plaats van dat hij een vredig einde van zijn leven kreeg zoals de meeste andere 60-jarige dieren, werd George aangespoord om te paren met andere ondersoorten, wat geen succesvolle nakomelingen opleverde. Hij stierf in 2012, en zijn hele dier soort met hem.
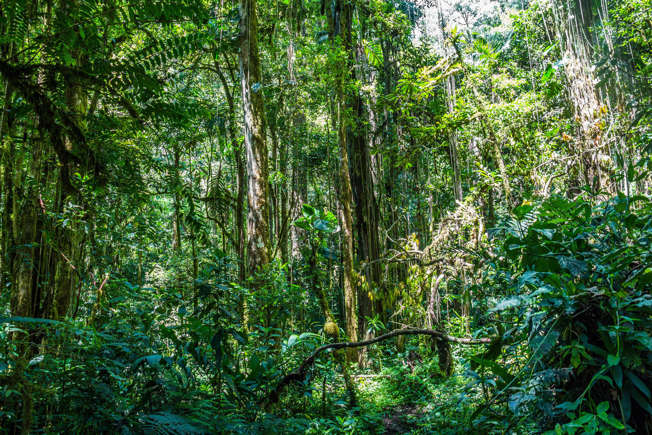
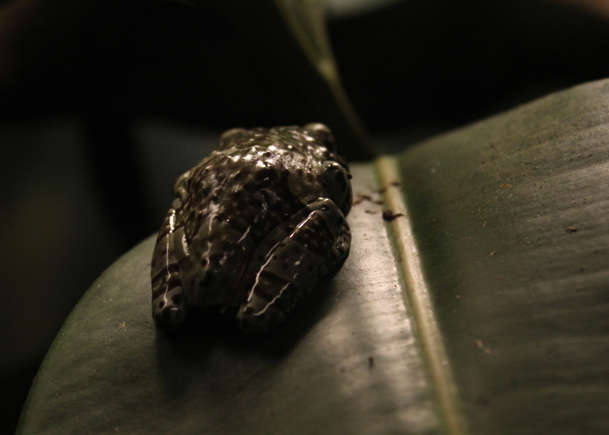
Toughie de kikker Toughie was de laatste boomkikker van de Rabbs ter wereld, een soort die gewoonlijk werd aangetroffen terwijl hij van de ene boom naar de andere zweefde in het regenwoud van Panama.
Hij werd in gevangenschap gebracht om hem te beschermen tegen een wijdverbreide infectie die de rest van zijn soort doodde, maar het leven dat hem te wachten stond, bevond zich naar verluidt in een saaie, grijze zeecontainer ver van een regenwoud.
Toughie de kikker Toughie werd niet gedwongen te paren, aangezien kikkers alleen paren met hun eigen soort, en het laatste vrouwtje van zijn soort al was gestorven. Hij heeft zeven jaar alleen gewoond.
Het treurigste aan Toughie's verhaal is echter dat hij, toen hij eenmaal in gevangenschap was, zijn paringsoproepen volledig stopte en niet meer wilde reageren op opgenomen oproepen, alsof hij wist dat er niemand meer voor hem was.
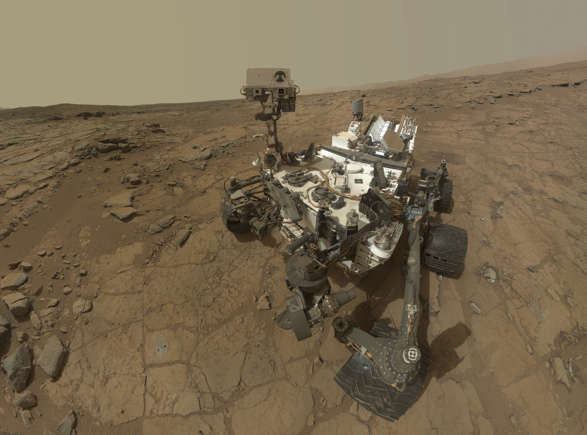
Curiosity de rover Alleen op een planeet die vele lichtjaren van huis verwijderd is, heeft de Curiosity-rover bijna zeven jaar op Mars doorgebracht, maar hoe eenzaam kan een robot zijn?
Curiosity de rover Welnu, op de eenjarige verjaardag van de landing op Mars zong de kleine Curiosity 'Happy Birthday' voor zichzelf. Het had officieel de eenzaamste verjaardag in de Melkweg.
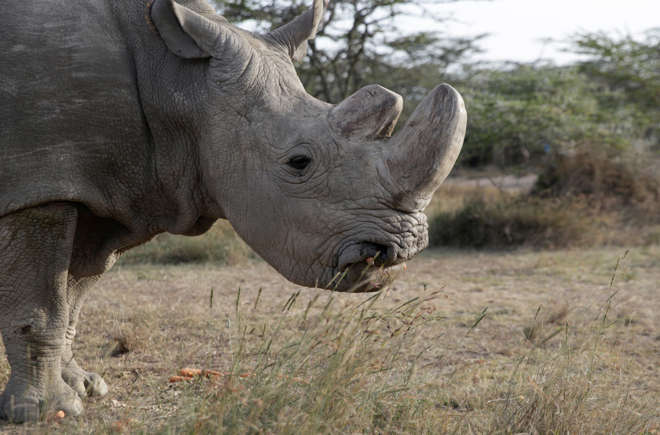
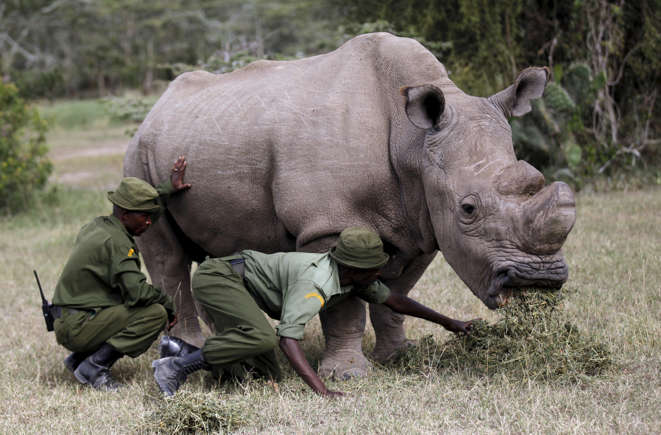
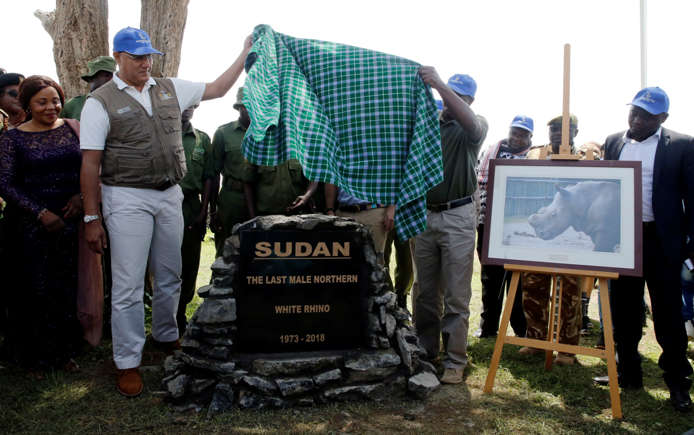
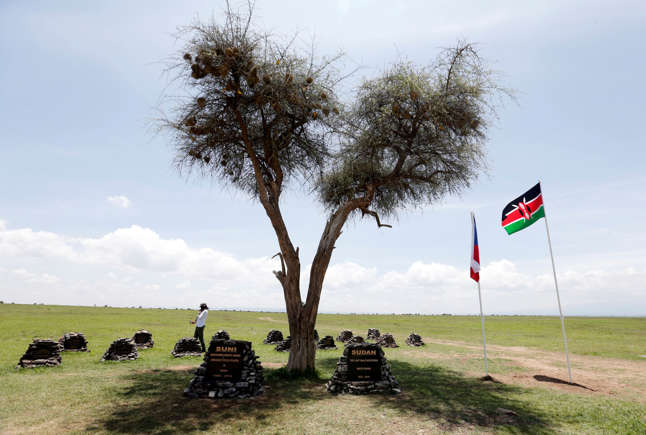
Sudan de neushoorn Sudan, een noordelijke witte neushoorn, werd in 2009 naar de Ol Pejeta Conservancy in Kenia gebracht, in het gezelschap van nog een mannetje en twee vrouwtjes, die allemaal aan de massale stroperij ontsnapten.
Sudan de neushoorn Het overgebleven mannetje overleed in 2014, en alle druk om de witte neushoornsoort te redden werd op Sudan gelegd.
Sudan was al in de veertig en had een afnemend aantal zaadcellen en verzwakte achterpoten, waardoor het voor hem moeilijk werd een vrouwtje te bestijgen.
Sudan de neushoorn Hoewel Tinder geld inzamelde voor onderzoek naar in-vitrofertilisatie, zorgde de afnemende gezondheid van Sudan ervoor dat dierenartsen hem in 2018 lieten inslapen.
Sudan de neushoorn Nog tragischer is zijn nalatenschap, aangezien hij twee vrouwtjes, een dochter en kleindochter achterlaat als de laatst overgebleven leden van hun ondersoort.
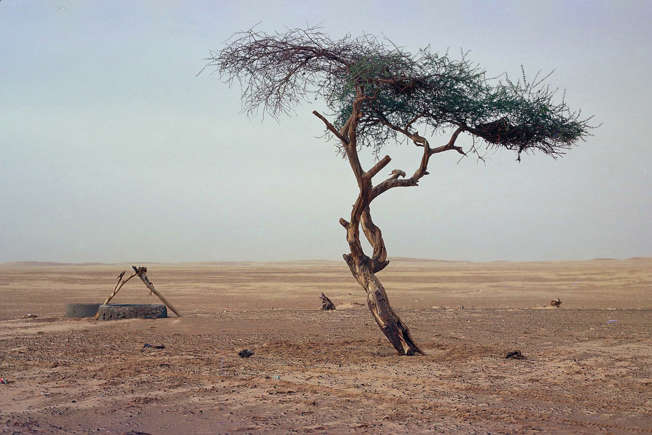
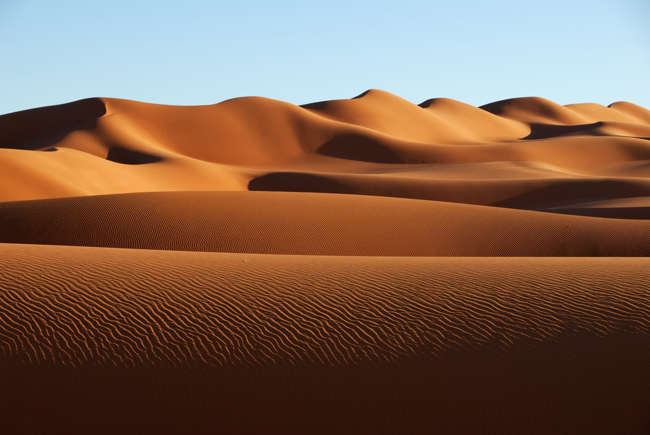
Boom van Ténéré Het is waarschijnlijk dat hij samen met vele anderen is ontsproten voordat de woestijn een woestijn werd, maar hij werd de enige overlevende nadat een in 1938 gegraven put hem een constante bron van water gaf.
Boom van Ténéré Aan zijn trotse maar eenzame strijd tegen de klok werd abrupt een einde gemaakt in 1973, toen een dronken bestuurder erin slaagde het enige obstakel in de honderden kilometers te bereiken. Een metalen sculptuur neemt nu zijn plaats in de woestijn in.
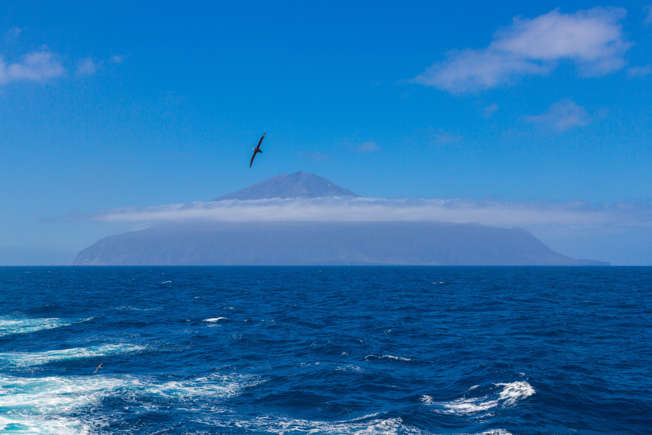
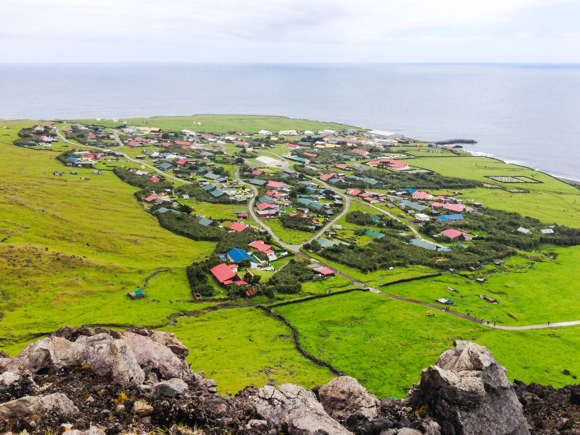
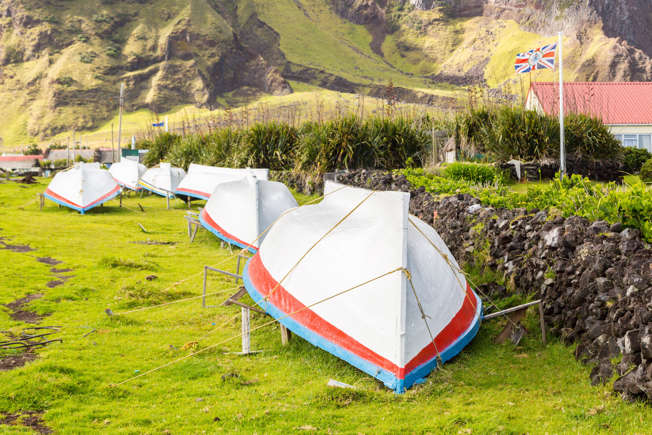
Het eenzaamste eiland ter wereld Tristan da Cunha is eigenlijk een archipel van vier eilanden, maar er is er maar één bewoond: het eiland Tristan da Cunha. Het is het meest afgelegen bewoonde eiland ter wereld.
Het eenzaamste eiland ter wereld Het buitengewone eiland, een slepend bezit van het Britse rijk, ligt in de verre Zuid-Atlantische Oceaan, duizenden kilometers van zowel de kust van Brazilië als Zuid-Afrika.
Het eenzaamste eiland ter wereld Het eiland heeft ongeveer 250 inwoners, wier enige manier om Tristan in en uit te reizen een zesdaagse boottocht is. Maar de inwoners zijn er naar verluidt dol op!
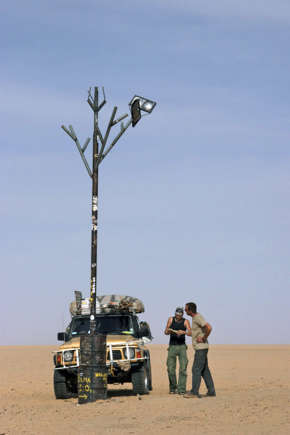
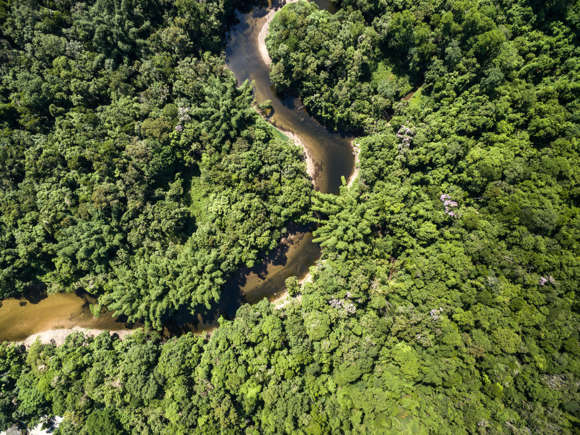
De "Man van het Gat" Een geïsoleerde inheemse man in Brazilië woont al minstens 22 jaar alleen in het Amazonegebied en noemt hem de eenzaamste man ter wereld.
Er wordt aangenomen dat hij het enige overgebleven lid van zijn stam is, toen vanaf de jaren '80 boeren, illegale houthakkers en landrovers hun grondgebied in Rondônia binnendrongen en hen afslachtten.
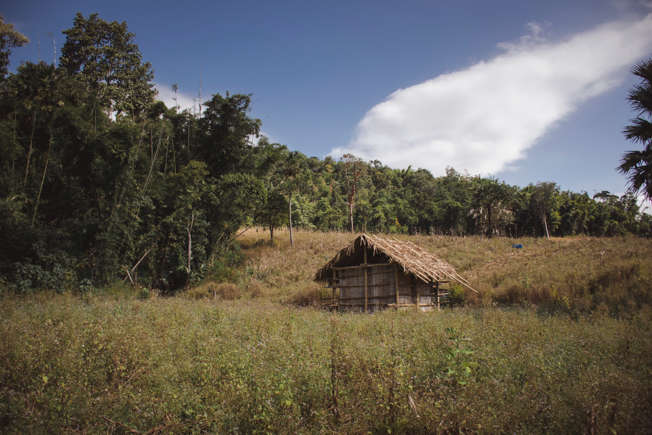
De "Man van het Gat" Hij kreeg zijn bijnaam vanwege de enorme gaten die hij in het bos heeft gegraven, om dieren in te vangen of zich voor mensen te verstoppen.
De "Man van het Gat" Niemand kent de naam van zijn stam of de taal die hij spreekt, maar FUNAI, het Braziliaanse departement voor inheemse zaken, heeft het land waarop hij leeft beschermd, ondanks dat hij naar verluidt pijlen heeft afgevuurd op medewerkers die contact met hem proberen op te nemen.
De "Man van het Gat" In 2018 bracht FUNAI zeldzame videobeelden uit van de man die halfnaakt in het bos stond en vurig met een bijl zwaaide. Helaas stierf de "Man of the Hole" in 2022.
Weetjes om mee uit te pakken bij vrienden, ook al zullen ze je waarschijnlijk voor gek verklaren. Deze 45 feiten klinken als leugens of nonsens, en toch zijn ze stuk voor stuk waar.
1. New York ligt zuidelijker dan Rome
Je hebt er mogelijk nooit bij stilgestaan, maar in Europa zou New York City zich in het zuiden van het continent bevinden. Zo ligt de Amerikaanse stad zelfs iets zuidelijker dan de Italiaanse hoofdstad Rome. De ligging van New York City zou ongeveer vergelijkbaar zijn met die van Madrid en Napels.
Brussel ligt overigens noordelijker dan om het even welke stad in de Verenigde Staten. Zelfs Quebec en Montreal bevinden zich meer in het zuiden. En Miami ligt zich ongeveer even zuidelijk als Zuid-Libië.
2. Tussen Noord-Korea en Noorwegen ligt slechts één land
Om van Noorwegen naar Noord-Korea te reizen, hoef je eigenlijk maar één land te doorkruisen: Rusland. In het uiterste noorden heeft het land van Kim Jong-un een kleine grens van enkele tientallen kilometers met Rusland. De meest nabijgelegen Russische stad is Vladivostok. In Lapland grenst Rusland voor een klein stukje ook aan Noorwegen.
Andere landen die enkel door Rusland van Noord-Korea gescheiden worden zijn onder andere Finland, Estland, Letland, Wit-Rusland en Oekraïne.
3. Als je met een vinger in je oor krabt, klinkt dat net zoals Pac-Man
Dit is een weetje dat je zelf even moet uittesten. Je zal inderdaad het geluidje van het populaire spelletje uit 1980 herkennen.
4. De naam ‘Jessica’ is door Shakespeare bedacht
William Shakespeare heeft niet alleen op de literatuur z’n stempel gedrukt. Hij bedacht met z’n werk ook enkele namen die vandaag populair zijn. Het beste voorbeeld is Jessica, een naam die historisch geen referentie heeft voor Shakespeare hem introduceerde in The Merchant of Venice. De naam is mogelijk wel afgeleid van de Hebreeuwse mannennaam Iscah.
Ook de naam Miranda zou mogelijk voor het eerst door Shakespeare gebruikt zijn. Al is die naam misschien ook van een Latijns woord afkomstig.
5. Anne Frank en Martin Luther King zijn in hetzelfde jaar geboren
In 1929 zijn twee figuren geboren die elk om hun reden in de geschiedenisboeken staan. Op 15 januari zag Martin Luther King het levenslicht. Hij is een van de beroemdste activisten in Amerika en werd in 1968 vermoord. Anne Frank is op 12 juni geboren en werd bekend dankzij haar dagboek dat ze bijhield terwijl ze tijdens de Tweede Wereldoorlog in Amsterdam was ondergedoken. Ze overleed in februari 1945.
6. Er zit minder tijd tussen het leven van Cleopatra en de uitvinding van de iPhone dan tussen Cleopatra en de eerste piramide
We associëren Cleopatra wel eens verkeerdelijk met de piramiden in Egypte. Ze was wel de koningin van het oude Egypte, maar zelfs voor haar waren de piramiden al verre geschiedenis. De eerste piramide zou rond 2700 voor Christus gebouwd zijn. Cleopatra werd in 69 voor Christus geboren.
De eerste iPhone is in 2007, zo’n 2.078 jaar later, gelanceerd. En dat is dus een slordige 600 jaar minder dan er tussen die eerste piramide en de tijd van Cleopatra verstreken is.
7. Rusland heeft een grotere oppervlakte dan Pluto
Het grootste land ter wereld is Rusland, maar wist je al dat het land groter is dan de totale oppervlakte van Pluto. Ooit was dat de verste bekende planeet uit ons zonnestelsel, maar na discussie over die status is bepaald dat Pluto een dwergplaneet is. Met een oppervlakte van meer dan 17 miljoen vierkante kilometer is Rusland groter dan Pluto.
8.Saoedi-Arabië importeert kamelen uit Australië
Het klinkt onwaarschijnlijk, maar Saoedi-Arabië begon in het begin van deze eeuw met het importeren van kamelen uit Australië. Sinds de negentiende eeuw lopen er ook Down Under kamelen rond, en sindsdien is hun aantal fors toegenomen. Saoedi-Arabië kampte dan weer met een tekort aan kamelen, aangezien het vlees van de dieren er gegeten wordt. Om aan de consumptie te blijven voldoen, moeten ze dus bij Australië aankloppen.
9. Nijlpaardenmelk is echt niet roze
Eén onwaarschijnlijk feit willen we hier toch even ontkrachten. Een hardnekkig gerucht op het internet luidt dat melk van nijlpaarden roze is. Die mythe blijft maar bestaan, mede omdat zelfs National Geographic zich ooit liet vangen en het gerucht via de sociale media verspreidde. Toch is de melk niet echt roze.
Nijlpaarden scheiden wel een soort zweet af dat onder invloed van de zon rood kan kleuren. Wanneer hiervan een beetje in de melk terechtkomt, kan die een rozig tintje krijgen. Maar voor alle duidelijkheid: de melk van een nijlpaard is net zoals andere melk gewoon wit.
10. De volledige naam van Barbie is Barbara Millicent Roberts
Iedereen noemt de bekende pop gewoon Barbie, maar haar officiële naam is Barbara Millicent Robert. En haar vriendje Ken heeft Carson als achternaam.
De cowboy uit Toy Story heet dan weer voluit Woody Pride. En het Koekiemonster uit Sesamstraat heet eigenlijk Sid.
11. Wortels waren vroeger paars
Bij een wortel denken we bijna automatisch aan de kleur oranje. Nochtans waren wortels oorspronkelijk paars. In Nederland werd vanaf het einde van de zestiende eeuw een zoete, oranje variant gekweekt. Deze oranje wortel kreeg vermoedelijk al gauw de voorkeur, omdat dit ook de kleur was het Huis van Oranje en van de strijd om onafhankelijkheid.
Maar voordien waren paarse wortels dus heel normaal, met zelfs variaties in geel en wit. Vandaag zie je restaurants terug uitpakken met deze rijkdom aan kleuren.
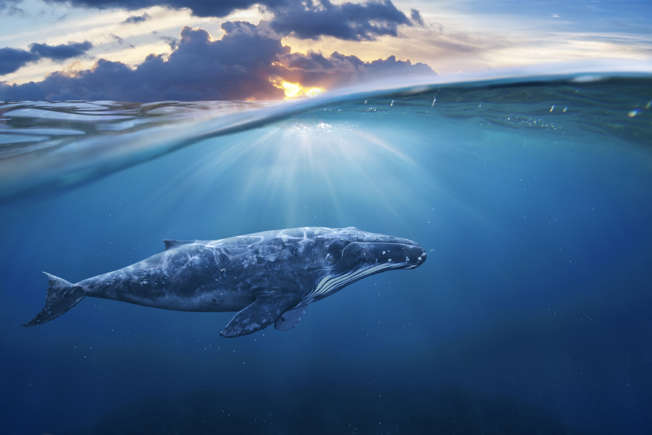
12. Een walvissenhart is zo groot dat een volwassen mens door de slagaders zou kunnen zwemmen
Walvissen zijn dieren met een groot hart. Letterlijk dan, want het hart van de kolossen van de oceaan is zo’n anderhalve meter lang, 120 centimeter breed en anderhalve meter hoog. Het weegt bovendien ongeveer 180 kilo.
Bij zo’n gigantisch hart horen ook enorm slagaders. Die zouden zelfs zo breed zijn dat een volwassen mens er doorheen zou kunnen zwemmen. Het hart van deze dieren wordt ook wel eens vergeleken met het formaat van een kleine auto. Het slaat overigens maar acht tot tien keer per minuut, en die hartslag zou onder water tot kilometers ver te horen zijn.
13. Je loopt twee keer meer risico om door een drankautomaat te worden gedood dan door een haai
De meeste haaien jagen helemaal niet op mensen, maar een ontmoeting loopt natuurlijk wel bijna altijd fataal af. Gelukkig is het aantal incidenten met haaien relatief beperkt. Enkele jaren geleden zette The Guardian vijf verrassende zaken op een rij die op basis van statistieken dodelijker zijn voor mensen.
Zo blijken in de Verenigde Staten vier tot zes keer meer mensen te sterven wanneer ze door een drank- of snackautomaat verpletterd worden. De apparaten richtten ook een pak meer verwondingen aan dan haaien.
De andere vier risico’s waar we voor moeten uitkijken: een slangenbeet (20.000 doden per jaar), bliksem (1.000 doden per jaar), verdrinken in bad, … en linkshandig zijn. Zo’n 2.500 linkshandigen sterven jaarlijks wanneer ze een voorwerp voor rechtshandigen moeten gebruiken.
14. Er zit meer tijd tussen de release van Home Alone en nu dan tussen die film en de maanlanding
Dit feit lijkt misschien verrassend aangezien de uitzendingen van Home Alone op het einde van het jaar bijna even standvastig zijn als het feit dat we dan Kerstmis vieren. De eerste film in deze franchise verscheen in 1990, en dat is intussen dus al meer dan 30 jaar geleden. De maanlanding dateert van 1969, met andere woorden ongeveer 21 jaar voor we met Kevin McCallister kennis maakten.
We kunnen er nog een schepje bij doen, want ook voor Home Alone 2 gaat deze rekensom op. Die verscheen in 1992, dus 27 jaar geleden en 23 jaar na de maanlanding. Over een paar jaar mogen we ook Home Alone 3 aan dit lijstje toevoegen.
15. Oxford University is ouder dan het Rijk van de Azteken
Een onwaarschijnlijk, maar historisch correct feit. Laten we beginnen met het rijk der Azteken. Dat bestond tussen 1200 en 1521 in het huidige Mexico. De laatste koning van dit volk kwam om het leven in de strijd met de Spaanse veroveraars, wat ook het einde van het rijk betekende.
De universiteit van Oxford bestaat al sinds 1096. Er zijn in elk geval bewijzen dat er in deze periode al les werd gegeven. Zeker in de loop van de twaalfde eeuw groeide het aantal studenten, omdat Engelse scholieren niet langer aan de universiteit van Parijs mochten studeren.
Enkel de universiteit van Bologna weerhoudt Oxford ervan om zelfs de oudste ter wereld te zijn. De Italiaanse instelling bestaat al sinds 1088. De universiteit van Cambridge werd pas in 1209 opgericht.
16. Frankrijk executeerde nog mensen met de guillotine toen de eerste Star Wars-film uitkwam
Dit feit is zo onwaarschijnlijk dat je er bijna het hoofd bij zou verliezen. De eerste film in de Star Wars-franchise kwam in 1977 in de bioscoopzalen. En dat is ook het jaar waarin Frankrijk voor de laatste keer iemand met de guillotine executeerde. Het apparaat waarmee vooral tijdens de Franse Revolutie bij duizenden ter dood veroordeelden het hoofd werd afgehakt, was ook in de jaren 60 en 70 van de vorige eeuw nog in gebruik. Tussen 1965 en 1977 zouden acht mensen op deze manier geëxecuteerd zijn.
In principe hadden er nadien nog een paar executies kunnen plaatsvinden, want pas in september 1981 schafte Frankrijk de doodstraf af. En de guillotine werd toen veroordeeld tot een plaats in de musea.
17. Het gordeldier baart bijna altijd identieke tweelingen
Gordeldieren zijn niet zo bekend bij het brede publiek, maar eigenlijk zijn het fascinerende wezentjes. Vooral hun voortplanting is interessant, want gordeldieren krijgen heel vaak identieke tweelingen. Sommige gordeldieren krijgen acht tot vijftien jonger per keer. En die groeien heel snel op, want na amper een jaar zijn ze al klaar om zichzelf voort te planten.
18.De eenhoorn is het nationale dier van Schotland
Heel wat landen hebben een nationaal dier dat ook echt een grote rol speelt in de natuur van de staat. Denk maar aan de kangoeroe in Australië, de springbok in Zuid-Afrika of de tijger in India. Maar de Schotten hebben lang geleden gekozen voor … de eenhoorn.
Dat mythische wezen bestaat natuurlijk niet echt, maar misschien is dat net de reden waarom het zo goed bij Schotland past. Eenhoorns worden immers beschouwd als de sterkste van alle dieren, wild en ontembaar.
19. Een aardbei is geen bes, maar bananen, avocado’s en watermeloenen zijn dat wel
Een aardbei, een banaan, een avocado en een watermeloen: welk van deze fruitsoorten is een bes? Onwaarschijnlijk: je zou denken aan een aardbei, maar dat is eigenlijk de enige in het rijtje die we geen bes mogen noemen. Mensen hadden duizenden jaren geleden al de neiging om bepaalde fruitsoorten bessen te noemen. Maar de wetenschap heeft hier pas later een definitie aan gegeven.
Bessen bestaan uit drie verschillende lagen, met in de binnenste laag de zaadjes. Dat is bij een aardbei niet het geval, maar je kunt die structuur wel herkennen in avocado’s, watermeloenen en zelfs bananen.
20. De laatste mammoet stierf duizend jaar na de bouw van de eerste Egyptische piramide
Intussen weten we dat de eerste piramide rond 2700 voor Christus gebouwd is. Toen waren de meeste mammoeten al uitgestorven, op een kleine groep na. In het oosten van Siberië wist een populatie tot 1650 voor Christus te overleven. Het rijk van de Egyptische farao’s bestond toen zelfs al 3.000 jaar. Uiteindelijk stierven ook deze laatste mammoeten, zodat we met zekerheid kunnen stellen dat Cleopatra de dieren nooit gezien heeft.
21. Er zijn in de hele wereld meer valse dan echte flamingo’s
Flamingo’s zijn een hype, die zodanig geëxplodeerd is dat er vandaag meer valse flamingo’s circuleren dan er echte vogels zijn. Zo zouden in het wild iets minder dan twee miljoen flamingo’s leven, terwijl er wereldwijd miljoenen valse exemplaren bestaat.
22. Nintendo bestaat al sinds 1889
Neen, dat is geen schrijffout in de titel. Toen Nintendo in 1989 de Super Nintendo-console uitbracht, bestond het bedrijf exact honderd jaar. In 1889 richtte Fusajiro Yamauchi Nintendo op als bedrijf dat speelkaarten produceerde. Nog voor Nintendo zich definitief op speelgoed begon te focussen, was het bedrijf onder andere bezig met het aanbieden van taxiritten en zelfs hotelletjes waar mensen een kamer konden boeken om seks te hebben.
In de jaren 70 evolueerde Nintendo dan naar een bedrijf dat videospelletjes maakte. Maar de roots van Super Mario liggen dus in een duister verleden waarover het bedrijf het vandaag niet meer zal hebben.
23. Als de zon niet groter was dan een witte bloedcel, dan zou de hele Melkweg even groot zijn als de Verenigde Staten
Deze vergelijking maakt vooral duidelijk hoe nietig onze planeet en onze zon eigenlijk zijn. Als je de zon zou verkleinen tot de schaal van een witte bloedcel en je het volledige sterrenstelsel op dezelfde schaal verkleint, dan zou de Melkweg de omvang van de Verenigde Staten hebben. En dus is onze zon niet meer dan een witte bloedcel in de hele VS.
En dat is enkel ons sterrenstelsel … In het volledige universum zouden er volgens schattingen minstens 100 miljard sterrenstelsel bestaan. En de kans is groot dat we dit cijfer eigenlijk nog mogen verdubbelen.
24. Will Smith is nu ouder dan zijn Uncle Phil was tijdens de eerste aflevering van The Fresh Prince of Bel-Air
Voor iedereen die in de 90s is opgegroeid, blijft The Fresh Prince of Bel-Air een symbolische reeks. Het was ook de doorbraak van Will Smith als wereldberoemd acteur. Onwaarschijnlijk, maar intussen is hij al 51 jaar oud. Dat is ouder dan zijn oom, Uncle Phil, in de allereerste aflevering van de serie. Acteur James Avery, die in 2013 overleed, was 45 jaar toen Will Smith aan zijn deur kwam aanbellen. Actrice Tatyana Ali, die de jongere Ashley speelde, is intussen ook al … 40 jaar!
25. We delen 60% van ons DNA met bananen
Ons lichaam bestaat uit drie miljard genetische bouwsteentjes, of basenparen. Dat maakt dat we maar voor een heel klein stukje verschillen van een andere persoon, en we allemaal voor 99,9% genetisch identiek zijn. Dat betekent ook dat we met andere levende organismen in de natuur veel genetische overeenkomsten hebben. Het meest verrassende is misschien wel dat we voor 60% hetzelfde DNA als een banaan hebben.
Minder verrassend is het feit dat we 96% van ons DNA met dat van chimpansees delen. Bij katten gaat het om 90%, en zelfs een muis heeft voor 85% dezelfde genetische structuur.
26. Voor de Tyrannosaurus Rex is de tijd van de Stegosaurus langer geleden dan de T-Rex voor de mens
We vergeten soms dat de mensheid nog maar heel kort over deze planeet loopt. Zo hebben de dinosaurussen er veel langer over gedaan. De Tyrannosaurus Rex, zowat de bekendste van alle dinosauriërs, leefde zo’n 60 tot 70 miljoen jaar geleden. Daardoor heeft de T-Rex ook een pak uitgestorven soortgenoten nooit gekend.
De Stegosaurus bijvoorbeeld, dat is de dinosaurus met grote puntige platen op zijn rug en een staart met stekels. Deze soort leefde zo’n 150 miljoen jaar geleden, een eeuwigheid dus voor de Tyrannosaurus Rex, die zelfs voor ons bijgevolg nog veel recenter is. De Stegosaurus moest in zijn tijd met een ander roofdier rekening houden: de Allosaurus.
27. Alaska is tegelijkertijd de meest noordelijke, westelijke én oostelijke staat van de VS
Een blik op de wereldkaart maakt meteen duidelijk dat Alaska de meest noordelijke en westelijke staat van de VS is. In theorie moet dit betekenen dat de meest oostelijke staat ergens aan de oostkust moet worden gezocht. En dan zou het meest oostelijke punt in de staat Maine liggen.
In de Stille Oceaan bevindt zich echter de eilandengroep Aleoeten, die officieel bij Alaska hoort. De eilanden strekken zich zover uit dat ze geografisch in de oostelijke hemisfeer liggen. En dus is Alaska eigenlijk ook de meest oostelijke staat van de VS. De meest zuidelijke staat is overigens Hawaï.
28. Pluto maakte sinds zijn ontdekking nog niet één volledige baan rond de zon
Officieel is Pluto intussen geen planeet meer, maar een onwaarschijnlijk feit is dat hij sinds zijn ontdekking in 1930 nog niet één keer volledig rond de zon is kunnen draaien. Pluto doet daar namelijk 248 aardse jaren over. De zon zou je op Pluto overigens niet echt kunnen zien, want de dwergplaneet staat veertig keer verder van z’n ster dan de aarde.
29. Een miljard seconden duren ongeveer 32 jaar
Wanneer je 32 jaar oud bent, zijn ongeveer één miljard seconden in je leven verstreken. Duizend seconden duren zowat 16 minuten, een miljoen seconden komen overeen met elf dagen. En voor duizend miljard seconden heb je ongeveer 32.000 jaar nodig.
30. Honing wordt nooit slecht
Zelfs na die duizend miljard seconden mag je nog steeds van een pot honing eten. Honing wordt namelijk nooit slecht. Het bevat een hoge zuurtegraad die zowat alles doodt dat zich in de honing zou willen nestelen. Enkele andere voedingsmiddelen die hooguit in de verre toekomst een vervaldatum hebben: witte rijst, suiker, zout en sojasaus.
31.Er zijn meer sterren in de ruimte dan zandkorrels op aarde
We weten intussen wel dat we in het hele universum bijzonder klein zijn, maar met deze vergelijking wordt duidelijk hoe klein. Er zouden in het hele heelal tien keer meer sterren zijn er zandkorrels in al onze woestijnen en op alle stranden ter wereld samen liggen. Natuurlijk gaat het om slechts schattingen, want zowel het tellen van zandkorrels als het berekenen van het aantal sterren is onbegonnen werk.
32. Er zijn meer bibliotheken dan McDonald’s-restaurants in de VS
De Verenigde Staten zijn dan wel een voedingsbodem voor grote ketens, toch zijn openbare bibliotheken ook nu nog talrijker. In totaal zijn er ongeveer 17.000 bibliotheken. Vorig jaar waren er ter vergelijking net geen 14.000 McDonald’s-zaken. De hamburgerketen kent overigens al een tijdje een hele lichte terugval in het aantal Amerikaanse restaurants.
Starbucks heeft misschien wel een kans om over een paar jaar meer zaken te hebben dan er in Amerika bibliotheken zijn. Nu al zit de keten aan bijna 15.000 filialen in de VS.
33. Voor iedere mens op aarde zijn er ongeveer 1,6 miljoen mieren
Het is onmogelijk om exact te weten hoeveel mieren er op aarde rondkruipen, maar ze zijn in elk geval met veel, minstens 100 biljoen. In een BBC-documentaire werd dan ook ooit gesteld dat het gewicht van alle mieren samen evenveel zou zijn als dat van alle mensen bij elkaar.
34. Een octopus heeft drie harten
Een octopus is niet alleen uiterlijk een bizar wezen, ook langs de binnenkant zijn de dieren bijzonder. Ze hebben namelijk drie harten: eentje pompt bloed doorheen het lichaam, en de twee andere pompen bloed naar de kieuwen. De reden hiervoor heeft wellicht te maken met de structuur van het bloed. Hun rode bloedcellen bevatten namelijk hemocyanine, dat rijk is aan koper, in plaats hemoglobine, dat rijk is aan ijzer. Dat maakt hun bloed overigens ook blauw!
Aangezien hemocyanine minder efficiënt is in het vervoeren van zuurstof, helpen de drie harten hiervoor te compenseren door bloed aan een hogere druk rond het lichaam te pompen.
35. Elke 5.000 baby’s wordt er eentje zonder anus geboren
Jaarlijks zien een pak baby’s zonder anus het levenslicht. In de meeste gevallen zit er een stukje huid in de weg of is de anus misvormd. Soms hebben deze kinderen nog andere aandoeningen, zoals problemen met de nieren. In de meeste gevallen is een chirurgische ingreep noodzakelijk.
36. Je kunt niet neuriën terwijl je je neus dichtknijpt
Nog eentje op uit te proberen: knijp je neus dicht en probeer te neuriën! Lukt het niet? Dat is normaal, want bij het neuriën sluit je je mond en verplaatst het geluid zich door je neus. Wanneer je die neus dichtknijpt, kan je dus onmogelijk geluid produceren.
37. Op Saturnus en Jupiter regent het soms diamanten
De grote gasplaneten van ons zonnestelsel hebben een bijzonder soort neerslag. Het regent er soms diamanten die groot genoeg zijn om in een ring te worden gedragen. Bij onweer wordt methaan omgezet in roet (koolstof). Dat stort vervolgens naar beneden, terwijl het verhardt. Eerst verandert het in grafiet, later in diamant.
Eigenlijk zijn dit zowat de hagelstenen van deze planeten, maar een lang leven hebben de diamanten niet. Ze smelten uiteindelijk weg in een vloeibare zee rond de hete kern van deze reuzen.
38. Als je een blad 42 keer vouwt, zou het dik genoeg zijn om tot aan de maan te reiken
Natuurlijk valt dit niet met een eenvoudig blaadje papier te bewijzen, maar het is wiskundig wel zo dat papier vouwen exponentieel werkt. Als je een blad twee keer vouwt, is het vier bladzijden dik. Doe je het drie keer is het acht bladzijden dik. Na twintig keer vouwen zou je al aan de top van de Mount Everest zitten. En bij de 42ste keer zit je aan de maan …
39. Als je een gat naar het midden van de aarde boort en er een boek in gooit, duurt het 38 minuten voor het boek de kern bereikt
Lange tijd was het idee dat het 42 minuten en 12 seconden zou duren om de kern van onze planeet te bereiken, maar een realistischer model heeft enkele jaren geleden berekend dat dit vier minuten sneller zou gaan: 38 minuten en 11 seconden. Natuurlijk blijft dit hypothetisch, want het is onmogelijk om een gat naar het centrum van de aarde te boren.
40. Meer dan de helft van ons lichaam is niet menselijk
Het aantal menselijke cellen in ons lichaam beperkt zich tot 43%. De andere cellen zijn bezoekers afkomstig van bacteriën en fungi. Vooral in de geneeskunde is dit belangrijke kennis, omdat het helpt om behandelingen voor allerlei ziekten te ontwikkelen.
41. Pindanoten groeien ondergronds en zijn daarom geen noten
Hoewel het woordje een onderdeel van de term is, zijn pindanoten officieel geen noten. Meer zelfs, we moeten pindanoten eerder als groenten bestempelen. Noten groeien immers aan bomen, terwijl een pindanoot onder de grond groeit.
We kunnen nog een stapje verder gaan, want ook walnoten, cashewnoten, pistachenoten en amandelen zijn in principe geen echte noten. Zij worden beschouwd als de zaadjes van de bomen waar ze aan groeien, wat hen dan weer in de buurt van fruit brengt.
42. Een schildpad kan uit zijn anus ademen
Sommige schildpaddensoorten die in het water leven, hebben tijdens de wintermaanden bijna geen energie nodig. Ze absorberen daarom zuurstof uit het water via oppervlakken van het lichaam waar bloedvaten worden blootgesteld. En dat blijkt vooral rond hun anus sterk het geval te zijn. In wetenschappelijke termen heet dit fenomeen overigens cloacale ademhaling.
43. Er zitten meer atomen in één glas water dan het aantal glazen water in alle oceanen ter wereld
Er zitten bijzonder veel moleculen in een glas water. In totaal zou je ruim duizend meer atomen in een glas water kunnen tellen dan het aantal glazen dat je met al het water uit de oceanen zou kunnen vullen.
44. De kans is bijna 100% dat je volgende glas water een molecule bevat die ooit door het lichaam van een dinosaurus is gepasseerd
Simpel uitgedrukt drinken we allemaal de urine van dinosaurussen. Slechts 0,01% van het water op deze planeet wordt door mensen en dieren opgedronken, en dat water loopt doorheen een cyclus.
Belangrijke opmerking: de dino’s hebben heel lang op deze planeet rondgelopen, de mens is er veel minder lang. Volgens de cyclus betekent dit dus dat ons drinkwater in principe nog geen moleculen kan bevatten die andere mensen ooit hebben opgedronken. Maar de kans is dus groot dat een dinosaurus dat wel gedaan heeft.
45. Op het moment van je geboorte was je heel even de jongste persoon ter wereld
Om af te sluiten nog een logische, maar toch onwaarschijnlijk straffe opmerking: we zijn allemaal ooit de jongste persoon ter wereld geweest. Al is het maar een fractie van een seconde. Volgens de globale statistieken worden er iedere seconde immers vier kinderen geboren. Dat zijn er 250 per minuut, 15.000 per uur en 360.000 per dag. Na 24 uur is een pasgeboren kind dus al lang niet meer een van onze allerjongste aardbewoners.
Elon Musk, With All His Accomplishments, Can We Rule Out He's An Alien? Nope! UFO Sighting News.
Elon Musk, With All His Accomplishments, Can We Rule Out He's An Alien? Nope! UFO Sighting News.
Musk has a great since of humor, saying there is a graveyard full of his enemies, but there is a bit of truth to it. He's not human, he's an alien from an advanced civilization with an IQ that is off the charts. No human can outwit him, no human can defeat him. He came here on a mis££sion to advance humanity through innovation of technology, and he wont stop till he's completed it.
Inside the weird and wonderful world of Robbie Williams and Ayda Field: How the former Take That star went from 90s hellraiser to new-age vegan UFO hunter… with the help of his wife
Inside the weird and wonderful world of Robbie Williams and Ayda Field: How the former Take That star went from 90s hellraiser to new-age vegan UFO hunter… with the help of his wife
Turkey teeth, botox, hunting for aliens, and having baths surrounded with scented candles. It's a world away from Robbie Williams's drug, drink and sex-fuelled days during Take That's hey'day in the 1990s.
Williams' hell-raising rock star life during which he bedded more than a hundred women and was drinking a bottle of vodka a day is well and truly behind him - and his wife of 13 years Ayda Field has played a huge part in him turning his life around.
The 49-year-old now describes himself as a 'Coca-Cola lite agoraphobic' and would rather eat a tangerine than have sex.
He shares pictures to his three million Instagram followers of himself indulging in a zen-like vegan lifestyle, playing with his four children and their doll house.
And, he talks about his back 'being full of arthritis' and having plastic surgery as his 50th birthday nears in February.
It's a life in stark contrast from the cocaine and vodka binges and several stints in rehab he had in the late 1990s and early 2000s.
Robbie Williams, 49, and his American actress wife of 13 years Ayda Field, 44, who he credits with for saving his life
In its stark contrast to his hell-raising days of the late 1990s and early 2000s, when he openly admitted he battled with drugs and alcohol addiction
(Pictured in London in 1999)
The former Take That singer has candidly opened up about his darker days and mental health battles as he tried to cope with the enormous fame he experienced - with a four-part Netflix docu-series charting his roller-coaster career set to be released on November 8.
A year after he embarked on what would turn out to be a hugely successful solo career following his split from the boy band in 1995, he went on a six-day vodka and cocaine binge where he was vomiting 'black bile' and didn't sleep for 144 hours, believing he was 'indestructible'.
His drugs and alcohol battle was described by Williams as a 'fast track to death' and has seen him have several stints in rehab, including in 2007 after taking speed, acid, heroin, cocaine and 'heart-stopping' amounts of prescription drugs, reported The Sun.
Williams has previously revealed his ongoing battles with body dysphoria and anorexia, which he discusses in the Netflix series and how one time he was surviving on just one banana a day.
His love-life was just as frantic and saw him date a string of high-profile celebrities including Spice Girls Melanie C and Geri Horner, Lindsay Lohan, and All Saints' Nicole Appleton, while rumours swirled he bedded Kylie Minogue and Nicole Kidman.
Today, Williams' life has taken a complete turn and he has channelled his addictive personality into living a healthy lifestyle with his American actress wife Ayda, their four children - Teddy, Charlie, Coco, and Beau - through exercise, art, pickleball - and searching for aliens.
Gone are the days of drugs and alcohol, with the star, thought to have a net worth of £155 million, instead relaxing in soapy hot baths surrounding in lit candles and proud to be 23 years sober.
Williams pictured at the Nordoff Robbins Silver Clef Awards in London, in 1995. He split form Take That that year and 12 months later he went on a vodka and cocaine six-day binge where he was vomiting 'black bile'
The former Take That singer holds a bottle of Champagne in a car as he is spotted out and about in London in 1997
His drugs and alcohol battle was described by Williams as a 'fast track to death' and has seen him have several stints in rehab (Pictured in 1999 leaving the Hanover Grand nightclub, in London)
Williams' battles with addiction and mental health came during the height of his fame in the late 1990s and early 2000s (Pictured performing with Tom Jones at the Brit Awards in 2008)
Williams walks through Heathrow Airport with his face covered with a plastic mask of himself
His love-life was just as frantic and saw him date a string of high-profile celebrities including Spice Girls Melanie C and Geri Horner (pictured in 2000 St Tropez, France in 2000)
A weary-eyed Williams smokes a cigarette at the Quentin Tarantino Party at the Ministry of Sound in 1996
The Angels singer poses with bikini-clad models wearing black high heels in 1996 for a 7Up advert
He's turned to being vegan with his healthy meals being cooked up by a personal chef that are packed full of his five-a-day, while images on Instagram show him enjoying playing golf and boxing.
He has even rubbed shoulders with royalty having attended Princess Eugenie's wedding to Jack Brooksbank at Windsor Castle, with his daughter, Teddy, a bridesmaid.
Asked what caused such a dramatic change, Williams often returns to the same answer: Ayda.
Appearing on the Jonathan Ross show in 2020, the Angels hitmaker got emotional as he credited her with saving his life.
'I look back at 15 years of being with my wife, she did, she gave me a life,' he said.
'Here I am on the telly getting emotional. She absolutely did.'
That same year he spoke candidly about his relationship with his wife during an appearance on Jessie and Lennie Ware's Table Manners podcast.
The singer admitted it makes him want to 'cry' when he talks about Ayda as he revealed he feels 'safe' with her and their 'mini tribe' of children.
He said: 'It's a very special thing to have. In a very turbulent, unsafe world, our mini tribe, you know that saying people say "nothing outside can affect you when inside is safe", and that's how I feel. Nothing out there can hurt me when I am with her.'
Today, Williams' life has taken a 360 degree turn and he has channelled his addictive personality into living a healthy lifestyle with his American actress wife Ayda and their four children
Williams, dressed in a black cape, and Ayda attend the Giambattista Valli show at the Haute Couture Fashion Week, Paris, in 2022
From left to right: Laura Dunn, Beau Dunn, Ayda Field, and Williams at a Pickleball Tournament in Los Angeles, California, in April 2023
The singer posts images of his healthier lifestyle to his three million followers on his Instagram page
As well as pickleball, Williams exercises with boxing. He once challenged Oasis frontman to a boxing match in 2000
Gone are the days of drugs and alcohol, with the star, thought to have a net worth of £155 million, instead relaxing in soapy hot baths surrounding in lit candles and proud to be 23 years sober
Williams plays with his children and their doll house at his home in one heartwarming post on his Instagram page
Perhaps one of the more bizarre episodes in recent years saw him live stream snippets of his wife's labour where he sings to her.
But constant reminders of his battles are never too far away. Ayda still locks away painkillers out of fear he could relapse.
He told the On The Edge podcast with Andrew Gold: 'Something's always lurking around the corner and I still can't be trusted with pills.
'The wife has to put them behind lock and key... They can be there for 18 months, every single day. Vicodin, whatever, every day, see them, go to bed.'
He admits it's lucky he's still alive, but nowadays Williams' life appears calmer, content, and settled.
In one recent Instagram post he wrote: 'Im not worried about the future. It's amazing Im still here …
'My memory being s***,my thoughts being cloudy, my back being full of arthritis, My eyesight going, My looks fading, the elasticity of my skin being f*****, the hair thinning….ect,ect,ect.
'Im still here ,were still here….Still, so much to do….'
His partying antics have taken a toll on his health, though, with Williams revealing in a recent interview with The Sun how they had left him feeling 'knackered'.
'The hair is thinning, the testosterone has left the building, the serotonin is not really here and the dopamine said goodbye a long time ago,' he said.
'I’ve used up all of the natural good stuff. I’ve got the manopause.'
So what does he want to celebrate his 50th? Apparently he's going to gift himself a £20,000 neck life and some 'Turkey teeth' with the star already having had botox.
As for what else is ahead in the future, Williams has previously spoken of his fascination with UFOs and that 'something is up' and wants to go on a 'TV quest' in search of finding out if there's anything behind his mental health.
He once lavishly rented out a plane used by rapper Snoop Dogg and asked journalist Jon Ronson to go UFO hunting with him and wanted the documentary-maker to set up a night for him to spend a night in a haunted house in the search for ghosts. He changed his mind on the latter.
Speaking on Alan Buxton's podcast in January, Williams told of how he spotted an 'penalty box-sized' unidentified flying object 16 years ago when he was completely sober.
'This was flat and it appeared over a tree. It was matt black underneath had yellow stripes like The Hacienda (London nightclub).
'I didn't think "little green men", I thought "there's a bit of tech we are not being told about". I thought it was the American government.'
He has even rubbed shoulders with royalty having attended Princess Eugenie's wedding to Jack Brooksbank at Windsor Castle, with his daughter, Teddy, a bridesmaid
Grote opwinding onder wetenschappers als in 2017 voor de kust van Antarctica een monsterachtige ijsberg het levenslicht ziet. De ijsberg dobbert jarenlang rond en vindt uiteindelijk pas in 2020 zijn Waterloo. En nu blijkt ook die ondergang van de machtige ijsberg behoorlijk opwindend te zijn (geweest).
Want in een nieuw onderzoek – verschenen in het blad Geophysical Research Letters – schrijven wetenschappers dat de ijsberg – terwijl deze ten onder ging – een enorme impact had op zijn directe omgeving. Zo blijkt de ijsberg er eigenhandig voor gezorgd te hebben dat de oppervlaktetemperatuur van de Zuidelijke Oceaan lokaal met maar liefst 4,5 graad afnam. En ook het zoutgehalte liep door toedoen van de smeltende ijsberg met meer dan 60 procent terug. Het zijn grote veranderingen; groter dan alle andere veranderingen die wetenschappers ooit in reactie op een smeltende ijsberg hebben waargenomen.
Als een riviermonding in open zee “De A68-ijsberg was één van de grootste en best bestudeerde ijsbergen ooit,” vertelt onderzoeker Roseanne Smith. “Toen deze uiteen begon te vallen, was het een beetje alsof er een enorme riviermonding in de open oceaan was geïnstalleerd die koud, zoet water in de bovenste laag van de oceaan pompte.”
Over A68 De ijsberg waar het onderzoek van Smith en collega’s om draait, ontstond in 2017, toen een enorm stuk ijs van de Larsen C-ijsplaat voor de kust van Antarctica, afbrak. In eerste instantie was de resulterende ijsberg ongeveer net zo groot als de provincie Gelderland. Naarmate de tijd verstreek, braken er echter steeds meer stukken ijs van de ijsberg af. En in 2020 was deze nog ongeveer zo groot als Luxemburg. Rond diezelfde tijd had A68 – al dobberend – ook al een flinke afstand afgelegd en stevende deze af op het nagenoeg onbewoonde eiland Zuid-Georgië. En daar begint de ijsberg in datzelfde jaar uiteen te vallen en – al smeltend – enorme hoeveelheden koud, zoet water in een relatief klein deel van de oceaan te brengen. Wetenschappers zitten er bovenop; met behulp van satellieten observeren ze de smeltende ijsberg en hoe deze de bovenste centimeters van de Zuidelijke Oceaan lokaal beïnvloedt. Het resulteert in de ontdekking van ongeëvenaarde, lokale afwijkingen in de temperatuur en het zoutgehalte van de oceaan, zo is in het blad Geophysical Research Letters te lezen.
De reis van A68, van Antarctica naar Zuid-Georgië. Afbeelding: ESA.
Fytoplankton Het roept natuurlijk de vraag op in hoeverre die veranderingen ook de bewoners van die wateren hebben geraakt. Dat is op dit moment lastig te zeggen, vertelt Smith aan Scientias.nl. “A68 heeft waarschijnlijk de grootste directe invloed gehad op de onderste regionen van de voedselketen, oftewel op microalgen of fytoplankton – die aan het oppervlak van de oceaan leven. Elke soort is aan specifieke omstandigheden – waaronder een bepaalde watertemperatuur en een bepaald zoutgehalte – aangepast. Dus een verandering in die omstandigheden – zoals ontstaat wanneer een enorme ijsberg koud, zoet water in de nabijheid dumpt – is waarschijnlijk van invloed op een breed scala aan verschillende fytoplanktonsoorten in dit gebied.” Als je het zo bekijkt, lijkt de smeltende ijsberg dus slecht nieuws voor fytoplankton – en mogelijk ook de organismen hogerop in de voedselketen die voor hun overleving (grotendeels) van fytoplankton afhankelijk zijn.
Complex verhaal Maar het is een stuk gecompliceerder dan dat, vertelt Smith. Want zo’n smeltende ijsberg kan fytoplankton inderdaad het leven zuur maken door de temperatuur en het zoutgehalte van hun oude vertrouwde oceaan tijdelijk te veranderen. Maar tegelijkertijd kan de ijsberg de groei van (andere) fytoplanktonsoorten ook weer bevorderen. “Het smeltwater van de ijsberg is rijk aan opgelost ijzer en ijzer is iets wat de Zuidelijke Oceaan door de bank genomen mist. Dus ijsbergen kunnen de oceaan als het ware ‘bemesten’.” En zo de groei van fytoplankton stimuleren. “Dus als we kijken naar de gigantische ijsberg A68 en het smelten en ineenstorten daarvan voor de kust van Zuid-Georgië, in de zomer van 2020/2021, was die gebeurtenis dan goed nieuws voor algen? Dat is lastig te zeggen. Er groeit van nature namelijk ‘s zomers al veel fytoplankton in de wateren rond Zuid-Georgië. Voor nu wijzen satellietdata er echter voorzichtig op dat het fytoplankton in sommige gebieden toenam en in andere iets afnam.”
Tegelijkertijd kan op dit moment ook niet worden uitgesloten dat de smeltende ijsberg de omringende oceaan niet alleen op ijzer, maar ook op fytoplankton getrakteerd heeft. “Het is mogelijk dat de ijsberg zelf ook fytoplanktonsoorten herbergde die normaliter niet zo noordelijk voorkomen,” vertelt Smith. “Die soorten kunnen tijdens het smelten van de ijsberg zijn ontsnapt en in de wateren rond Zuid-Georgië zijn gaan groeien, omdat ze het wel prettig vinden in dat koude, zoete smeltwater dat rond hen vrijkwam.” Het is iets wat onderzoekers in eerdere studies naar andere (kleinere) smeltende ijsbergen wel hebben zien gebeuren. Maar of ook A68 fytoplankton meevoerde, is nog niet bewezen. “We hebben simpelweg te weinig bewijs om nu te zeggen dat dat het geval is. Ook kunnen we nog niet zeggen of het netto effect van de ijsberg op het ecosysteem van Zuid-Georgië nu positief of negatief was. Daar worden de komende maanden en jaren nog wel studies over gepubliceerd,” verwacht Smith. “Want er zijn in die tijd (dat de ijsberg smolt, red.) veel watermonsters verzameld en die worden nu nog onderzocht.” Wordt vervolgd dus.
Enorme afstand Wat we ondertussen wél zeker weten, is dat de impact van de ijsberg ook verder reikte dan de directe omgeving van Zuid-Georgië. Het koude, zoete smeltwater werd namelijk door stromingen in oostelijke richting van het eiland weggevoerd. En niet zo’n klein eindje ook. “Wat mij het meest heeft verrast, was de enorme afstand waarover de smeltwaterpluim van A68 verspreid werd,” vertelt Smith. “Voor A68 hadden we al vastgesteld dat temperatuurdalingen en veranderingen in het zoutgehalte van het water aan het oppervlak van de oceaan zelfs op tientallen kilometers afstand van de rand van de ijsberg nog gedetecteerd konden worden. Dat komt doordat het smeltwater door lokale stromingen wordt weggevoerd. Maar in het geval van A68 was het echt een heel ander verhaal: de pluim bestaande uit koel, zoet smeltwater werd over een enorme afstand weggevoerd. Op een gegeven moment was deze pluim zelfs meer dan 1000 kilometer lang! Dat is ongeveer de afstand tussen Parijs en Wenen!”
Heldenrol voor satellieten De enige reden dat onderzoekers überhaupt in staat waren om de enorme afstand waarover het smeltwater verspreid werd, vast te stellen, is dat ze gebruik maakten van satellietdata. “In de meeste eerdere studies naar smeltwaterpluimen van ijsbergen werd gebruik gemaakt van sensoren op schepen of boeien, maar je zou heel veel schepen en heel veel tijd (en dus ook heel veel geld) nodig hebben om op die manier de omvang van de smeltwaterpluim van A68 te meten. Alleen dankzij satellietdata is het ons gelukt om de volledige lengte en distributie ervan over een periode van meerdere maanden vast te stellen.”
Dat het smeltwater zo ver werd weggevoerd, betekent ook dat de impact die het smeltwater eventueel op fytoplankton nabij Zuid-Georgië had, in ieder geval tijdelijk was. “Het is onwaarschijnlijk dat de impact van het smeltwater na de winter van 2021 nog door de fytoplankton gevoeld werd,” stelt Smith. “De ijsberg was in april 2021 (oftewel tijdens de herfst op het zuidelijk halfrond, red.) volledig weggesmolten en het resterende koude, zoete smeltwater was toen door stromingen al bij Zuid-Georgië weggevoerd. Tegen het aanbreken van de lente was alles rond Zuid-Georgië waarschijnlijk weer als vanouds.”
Groeven in de zeebodem Is er dan anno 2023 niets meer dat ons herinnert aan het ontstaan en de ondergang van de machtige ijsberg A68? Zeker wel! “Daarvoor moeten we echter onder het ruwe, stormachtige oppervlak van de oceaan duiken, richting de bodem rond Zuid-Georgië,” vertelt Smith. “Het is gebruikelijk dat grote ijsbergen over de bodem van de zeebodem schuren als ze door relatief ondiep kustwater bewegen.” Het resulteert in blijvende groeven in de zeebodem. Ook beïnvloedt het alles wat op die zeebodem leeft. “Als ijsbergen over de zeebodem schuren, bulldozeren ze het fragiele ecosysteem op die zeebodem en dat kan erin resulteren dat meer dan 98 procent van de lokale dieren en planten sterft. Het kan vervolgens ook lang (in de orde van jaren) duren voor dat ecosysteem weer hersteld is.” Zuid-Georgië heeft al veel ijsbergen door haar kustwateren zien reizen, dus de zeebodem herbergt heel wat groeven die daarvan blijvend getuigen. “Van A68 wordt vermoed dat deze de zeebodem ten zuiden van Zuid-Georgië half december heeft geraakt,” vertelt Smith. En daarmee is het leven op de zeebodem mogelijk zodanig aangetast dat het wel even duurt voor het zich weer hersteld heeft. En de zeebodem zelf is in dat scenario sowieso voorgoed enkele groeven rijker.
Het onderzoek naar de impact die monsterachtige ijsbergen op de lokale oceaan en ecosystemen hebben, is belangrijk. Want de verwachting is dat we in de nabije toekomst veel meer van deze grote ijsbergen zullen zien ontstaan. “Klimaatmodellen laten zien dat een verdere opwarming van de atmosfeer en oceaan door broeikasgassen de stabiliteit van de vele ijsplaten rond Antarctica aantast. Als die ijsplaten uiteenvallen, kunnen ze in korte tijd veel grote ijsbergen in de Zuidelijke Oceaan loslaten,” legt Smith uit. “Meer ijsbergen betekent ook dat meer met ijzer verrijkt zoetwater de Zuidelijke Oceaan bereikt. En dat resulteert in een afnemend zoutgehalte en meer stratificatie in de bovenste delen van de oceaan, oftewel: die bovenste lagen gaan zich moeilijker mengen met diepere waterlagen.” Dat laatste heeft alles te maken met het feit dat zoet water een geringere dichtheid heeft dan zout water en dus minder makkelijk zinkt. “Het kan verschillende effecten hebben,” gaat Smith verder. Zo zorgt de stratificatie van het water ervoor dat oppervlaktewater moeilijker naar grote diepte zinkt. “En dat is belangrijk, omdat het zinken van dat oppervlaktewater helpt bij de opslag van koolstof en warmte in de diepere delen van de oceaan.” Daarnaast kan het smeltwater ook van invloed zijn op de aangroei van zee-ijs, zo verwachten de onderzoekers. “En dat is belangrijk, omdat zee-ijs helpt om de energie van de zon te reflecteren en minder zee-ijs betekent dus dat er meer zonne-energie (en dus warmte) wordt geabsorbeerd (en vice versa).” En ten slotte kunnen ijsbergen dus ook nog eens op verschillende manieren hun stempel drukken op lokale ecosystemen. “Welk van deze effecten het meest dominant zal zijn, is lastig te zeggen,” erkent Smith. “Maar als de frequentie waarmee grote ijsbergen ontstaan, substantieel toeneemt, kan het zijn dat de tijdelijke invloeden die elke individuele ijsberg heeft, zich gaan opstapelen en resulteren in grotere, langer aanhoudende en meer wijdverspreide veranderingen in de Zuidelijke Oceaan, met gevolgen voor zee-ijs, de groei van fytoplankton en het zinken van oppervlaktewater.”
The melting of the supergiant iceberg A-68 had a huge impact on the ocean around South Georgia, in sub-Antarctica,_Povl Abrahamsen, BAS
60 Thousand of Egrets Gather In Shimen Reservoir, Taiwan, Sept 17, 2023, News.
60 Thousand of Egrets Gather In Shimen Reservoir, Taiwan, Sept 17, 2023, News.
Date of sighting: Sept 17, 2023
Source:My Family video
Yeah this is not a UFO sighting video, it's better. Its a very rare occurring migration of the most beautiful and loved bird in Taiwan.
This is very rare to catch tens of thousands of white Taiwan Egrets at once not traveling but gathering together on the migration path. This video was sent to my by my Aunt who said it was a beautiful moment like no other. I have lived in Taiwan 25 years, and never before witnessed this size of a group of Egrets. Just an amazing sight to see. Recorded at Shimen Reservoir, Taiwan. Very rare, I just had to share this wonderful sight. Scott C. Waring - Taiwan
60 Thousand of Egrets Gather In Shimen Reservoir, Taiwan, Sept 17, 2023, News.
60 Thousand of Egrets Gather In Shimen Reservoir, Taiwan, Sept 17, 2023, News.
Date of sighting: Sept 17, 2023
Source:My Family video
Yeah this is not a UFO sighting video, it's better. Its a very rare occurring migration of the most beautiful and loved bird in Taiwan.
This is very rare to catch tens of thousands of white Taiwan Egrets at once not traveling but gathering together on the migration path. This video was sent to my by my Aunt who said it was a beautiful moment like no other. I have lived in Taiwan 25 years, and never before witnessed this size of a group of Egrets. Just an amazing sight to see. Recorded at Shimen Reservoir, Taiwan. Very rare, I just had to share this wonderful sight. Scott C. Waring - Taiwan
A team of researchers says they have developed a new technique that allows them to cool a small membrane to temperatures nearing absolute zero, the theoretically lowest temperature attainable, with nothing more than light from lasers.
For centuries, it has been understood that the reflection of light off the surface of objects produces a force. Such observations led astronomer Johannes Kepler to first envision the concept of solar sails which, like the sails that capture wind and propel boats across the ocean, could drive futuristic sailing vessels through space.
Such ideas helped early astronomers understand why the appearances of comets always revealed them to be oriented with their tails in the direction opposite of the Sun. Today, scientists are employing the light force in novel ways that allow atoms and other particles to be slowed down and thus cooled.
The results of such technology could enable innovative new applications that include sensors that possess unparalleled sensitivity. However, cooling particles down to such extreme temperatures, such as those nearing absolute zero, isn’t a simple task, and generally requires an array of specialized equipment.
Enter Professor Philipp Treutlein of the University of Basel, along with Dr. Patrick Potts, whose team has succeeded at producing a new process that allows a wafer-thin membrane to be cooled to such extremely cold temperatures—close to 273.15 Celsius—with nothing but laser light.
In the past, Professor Treutlein worked alongside Theodor W. Hänsch in his lab at LMU Munich and the Max-Planck-Institute of Quantum Optics, initially working as a doctoral student in Jakob Reichel’s team. Treutlein eventually went on to lead a team of his own, which undertook studies with ultracold atoms, primarily in what are known as “atom chips”, consisting of chip-based microtraps.
Through their studies, Terutlein and his team were able to demonstrate a chip-based atomic clock, as well as a unique atom interferometer, in addition to conducting some of the earliest experiments involving quantum metrology with entangled atoms.
In 2010, Treutlein came to the University of Basel, establishing a team that continued research into ultracold atoms, along with optomechanics (involving interactions between electromagnetic radiation and mechanical systems related to radiation pressure), as well as hybrid quantum systems.
The new technique Treutlein’s team of researchers devised is novel because the cooling effect they succeeded in engineering can be achieved even without any requirement for making measurements, which are significant in terms of the laws of quantum mechanics since measuring any component of a system will inevitably lead to a change in its quantum state, resulting in disturbances.
Although measurement is typically also required in things like a feedback loop, the Basel University researchers were able to find a workaround for this by developing what they characterize as a coherent feedback loop, where laser light is used to function as both a sensor, but also as a kind of damper that allowed them cool thermal vibrations in a small silicon nitrate membrane.
“Our platform consists of a light beam exerting a force onto a nanomechanical membrane oscillator,” the team reports in a recent paper detailing their experiments. “Vibrations of the membrane generate a phase modulation on the light, which serves as a readout signal.”
Directing a laser onto the membrane, the reflected light was fed into a 30-meter-long fiber optic cable that allowed optimal delay times of close to 100 nanoseconds, while vibrations in the membrane produced very minute changes in the oscillations of the light being reflected.
From the oscillations, the team was able to obtain information that was used with a time delay to determine the exact amount of force to be applied to the membrane with the same laser light.
Maryse Ernzer, a Ph.D. student and lead author of the new research paper outlining the team’s studies, compared it to “slowing down a swing by briefly touching the ground with one’s feet at the right time.
The lowest expected temperatures were calculated using a theoretical description based on the new technique, which the researchers say experimental results were able to thereafter confirm.
Postdoc researcher Dr. Manel Bosch Aguilera, also one of the team members, said in a statement that he and his colleagues succeeded in cooling the membrane to 480 micro-Kelvin, which approaches within one-thousandth of a degree of absolute zero.
Based on their findings, the researchers hope to find ways to improve their new technique, allowing future experiments with membranes under such conditions to be chilled to the lowest possible temperatures indicating the membrane’s quantum mechanical ground state.
Once this is achieved, the researchers foresee being able to create “squeezed states” in the membrane, conditions that would be useful in the construction of sensors with applications that include atomic force microscopes capable of observing surfaces at resolutions down to the nanometer.
The team’s paper, “Optical Coherent Feedback Control of a Mechanical Oscillator,” was published in Physical Review X.
Een 39 miljoen jaar oud fossiel suggereert dat er in vervlogen tijden een immense reus de wereldzeeën domineerde, die misschien wel 340 ton (!) zou hebben gewogen.
De blauwe vinvis is het grootste dier dat ooit heeft geleefd. Hij is zelfs groter dan de grootste bekende dinosaurus! Het langste exemplaar ooit waargenomen was 30 meter lang en woog een slordige 190 ton. Maar mogelijk moet de blauwe vinvis zijn prestigieuze titel als grootste en zwaarste dier op aarde nu afstaan. Want onderzoekers zijn op een stokoud walvisfossiel gestuit, waardoor ze nu geloven dat er in een ver verleden een nóg zwaarder dier heeft bestaan.
Fossiel Het gaat om een 39 miljoen jaar oud fossiel dat in het zuiden van Peru is opgegraven. Het fossiel omvat 13 wervels, vier ribben en een heupbot van een zogenoemde basilosauridae-walvis. Dit is een familie van uitgestorven walvisachtigen, die leefde in het midden tot het late Eoceen. Ze kwamen over de hele wereld voor, zelfs rondom Antarctica.
De bewaard gebleven botten van Perucetus colossus. Afbeelding: Giovanni Bianucci
Gewicht Aan de hand van de gevonden overblijfselen waren de onderzoekers in staat om het gewicht van de oude walvis, die Perucetus colossus is genoemd, te schatten. En daaruit blijkt dat zijn skeletmassa groter was dan die van enig bekend zoogdier of zeedier. Sterker nog, hij was waarschijnlijk 2 à 3 keer zo groot als een 25 meter lange blauwe vinvis. Vermoedelijk woog Perucetus colossus tussen de 85 en 340 ton. Hiermee wedijvert hij met het gewicht van de blauwe vinvis, waarvan eerder werd gedacht dat hij het zwaarste dier ooit was.
Van de troon gestoten Mogelijk heeft Perucetus colossus de blauwe vinvis dus van de troon gestoten. Niet de blauwe vinvis, maar Perucetus colossus is misschien wel het grootste en zwaarste dier dat (waar wij weet van hebben) ooit heeft bestaan. Deze ontdekking suggereert dat de gang naar gigantisme bij zeezoogdieren mogelijk eerder zijn intrede deed dan gedacht.
3D-model van het skelet van Perucetus colossus (geschatte lichaamslengte: 20 meter), samen met dat van een kleinere, naaste verwant (Cynthiacetus peruvianus) en een blauwe vinvis. Afbeelding: Trustees of the Natural History Museum; Marco Merella
Gigantisme Kijken we naar het gehele dierenrijk, dan zien we dat er maar weinig dieren gigantische proporties hebben bereikt. Het is eigenlijk een vrij zeldzame eigenschap. En dat is ook goed te verklaren. Het is namelijk een hele kostbare functie. Grote dieren hebben meestal minder nakomelingen, hebben meer ruimte nodig om te leven, eten meer en lopen ten slotte eerder het risico op ziektes zoals kanker. Naast de nadelen van gigantisme heeft een grotere omvang ook duidelijke voordelen – anders was het ook niet geëvolueerd. Het belangrijkste voordeel is voedsel. Ondanks het reusachtige lichaam, leven veel walvissen vrijwel uitsluitend van kleine kreeftachtigen die nog geen tien centimeter lang worden. Een groter lichaam is daarbij natuurlijk handig, omdat ze dan veel grotere happen kunnen nemen en zo in één keer meer voedsel naar binnen zuigen.
Evolutionaire geschiedenis Het fossielenbestand van walvisachtigen (een onderorde van zoogdieren waar ook dolfijnen, walvissen en bruinvissen onder geschaard kunnen worden) is heel belangrijk bij het documenteren van de evolutionaire geschiedenis van zeezoogdieren. Veel mensen denken dat de voorouders van walvissen in zee hebben geleefd, maar dat is niet het geval. Walvissen stammen namelijk af van dieren die van het land terug de zee in zijn gegaan. Onderzoekers proberen daar nog altijd meer over te weten te komen. Ondertussen zijn ze al op bepaalde aanpassingen gestuit die hand in hand gingen met die terugkeer naar het water. Denk in dit geval aan gigantisme en de daarmee samenhangende toename van de lichaamsmassa, hoewel wordt aangenomen dat laatstgenoemde een relatief recente diversificatie is geweest.
30 miljoen jaar eerder Maar de nieuwe studie suggereert nu iets anders. De opgegraven fossiele resten van Perucetus colossus zijn namelijk 39 miljoen jaar oud. Bovendien blijkt dat deze gigant al over verschillende kenmerken beschikte die erop wijzen dat hij al volledig was aangepast aan een wateromgeving. Dit betekent dat walvisachtigen zo’n 30 miljoen jaar eerder dan gedacht al hun maximale lichaamsgewicht hadden bereikt. Het drijfvermogen dat gepaard gaat met de toename van botmassa komt overeen met een levensstijl in ondiep water. Dit ondersteunt de heersende theorie dat basilosauridae-walvissen goed aangepast waren aan kustomgevingen.
De studie werpt meer licht op deze orde van oude dieren. Maar dat niet alleen. Het laat vooral zien dat er in vervlogen tijden immense giganten door de zeeën zwierven, die zelfs groter en zwaarder waren dan de befaamde blauwe vinvis. Of er misschien nóg zwaardere dieren dan Perucetus colossus hebben geleefd? Dat valt natuurlijk niet uit te sluiten. We houden de wetenschap in de gaten.
Researchers in Antarctica were recently stunned by their discovery of a thriving community of crab-like creatures living under the ice. Initially on-site to study a river hundreds of kilometers from the Ross Ice Shelf, the research team that stumbled upon the unexpected find said they were shocked and pleasantly surprised to find life where there should be none.
IN ANTARCTICA, LIFE FINDS A WAY
A picture shows the wildlife teaming under the Antarctic ice shelf. Researchers came across it unexpectedly.
NIWA / CRAIG STEVENS
In the 1993 filmJurassic Park and its most recent 2022 incarnationJurassic World: Dominion, Jeff Goldblum’s character Ian Malcolm famously observes that even against incredible odds, “life finds a way.”
Researchers looking for signs of life outside of the planet Earth have taken this idea to heart, increasingly focusing on the types of life forms that exist and even thrive in our planet’s most inhospitable environments. Often dubbed ‘extremophiles,’ these hardy, resilient life forms have been found in the deepest parts of the ocean and even thousands of feet below the Earth’s surface.
“The discovery represents the first-ever record of a rocky natural environment supporting life deep beneath an Antarctic ice shelf,” The Debrief wrote at the time. “BAS says the finding goes against all previous theories of what types of life could survive in such extreme conditions.”
It was a “big surprise,” said Professor Craig Stevens, a NIWA Physical Oceanographer who was part of the team in a press release announcing the unexpected discovery.
“For a while, we thought something was wrong with the camera, but when the focus improved, we noticed a swarm of arthropods around 5mm in size,” Stevens added. “We were jumping up and down because having all those animals swimming around our equipment means that there’s clearly an important ecosystem there.”
According to Stevens, the discovery prodded the research team to temporarily pause their research into the effects of climate change on the local environment and instead focus on understanding what it was they had actually found.
“We’ve taken some water samples back to the lab to look at the DNA and other properties of the water to see what makes it unique,” he said, “as we were observing something not seen in other systems close by.”
Huw Horgan, associate Professor of geophysical glaciology at the Antarctic Research Center at Victoria University of Wellington (and the project’s lead), said that finding the unexpected system of life was like “being the first to enter a hidden world.”
“It was an incredibly exciting expedition because of the rare opportunity it offered to study this type of environment.”
LIFE IN ANTARCTICA MAY AID THE SEARCH FOR EXTRATERRESTRIAL LIFE
Since the shocking discovery, the research team has resumed its original mission to study the local environment. However, they reportedly left behind enough instruments to monitor their newly discovered ‘nest of life’ well beyond the initial discovery.
“We’ve left instruments there that should provide observations for years to come,” said Horgan. “This will tell us about the water flow, temperature and pressure at two-minute intervals so we can get a good picture of how the river behaves and how it interacts with the ocean and ice sheet.”
With NASA and the world’s other space organizations increasingly focusing the search for extraterrestrial life on icy worlds with underground oceans like Jupiter’s moon Europa or Saturn’s moon Enceladus, understanding our own sub-surface life forms will become increasingly critical.
Connect with author Christopher Plain on Twitter@plain_fiction
The oceans teemed with eukaryotic micro-organisms (modern eukaryotic cell pictured; artificially coloured) more than one billion years ago.
Credit: Dennis Kunkel Microscopy/Science Photo Library
Rocks hundreds of metres beneath the Australian Outback have yielded clues to a lost world of primitive microbes that once populated the world’s oceans and might have eventually given rise to modern plants and animals.
Analysis of fat-like molecules isolated from the rocks suggests that they were made by a previously undiscovered, ancient population of organisms called eukaryotes, the group of living things whose cells typically contain a nucleus and other internal compartments. The molecules are 1.6 billion years old and hint that eukaryotes were abundant and widespread much longer ago than earlier biochemical evidence had suggested.
“The previous story was that eukaryotes were extremely rare until 800 million years ago,” says Phoebe Cohen, a palaeobiologist at Williams College in Williamstown, Massachusetts, who was not involved in the research. “Palaeontologists really bristled at that, because that’s not what we were seeing in the fossil record.” The findings, she says, help to bridge the gap between the two types of evidence.
The new results were published on 7 June in Nature1.
Chemical fingerprint
Most modern eukaryotes rely on fat-like compounds called sterols, such as cholesterol, to build cell membranes and carry out other cellular functions. Because sterols are found throughout the eukaryotic family tree, they are thought to have been present in the last common ancestor of all modern eukaryotes. For that reason, palaeontologists have used the compounds as a biomarker for the presence of eukaryotes in ancient rocks.
But look further back in time than 800 million years ago, and the sterol-trail runs dry. Researchers have not been able to find traces of the compounds in rocks older than that, despite the existence of fossils of a red and a green alga — both eukaryotes — dating back about one billion years.
This absence has led to speculation that before 800 million years ago, eukaryotes were not abundant enough to leave a detectable sterol trace.
Another possibility, however, was that researchers were looking for the wrong molecules. Benjamin Nettersheim, a geobiologist at the University of Bremen in Germany, Jochen Brocks, a palaeobiogeochemist at the Australian National University in Canberra, and their colleagues decided to focus on short-lived molecules that modern eukaryotes make while synthesizing sterols. Such modern intermediates might have been the end product for primeval eukaryotes.
Wild ocean
The team combed rocks from around the world and found widespread traces of these ‘protosterols’ — evidence that the eukaryotes that produced them were abundant in water environments between 800 million and 1.6 billion years ago.
This contradicts previous thinking, says Nettersheim. One possibility is that eukaryotes that make more-modern sterols gained a selective advantage between one billion and 800 million years ago, eventually displacing their protosterol-making counterparts.
The work could show why scientists could not find biochemical traces to confirm the fossil record, says Laura Katz, a biologist who studies microbial eukaryotes at Smith College in Northampton, Massachusetts. “We were just looking for the wrong thing.”
But Andrew Roger, who studies comparative genomics and the evolution of eukaryotes at Dalhousie University in Halifax, Canada, notes that fossilized red and green algae dating back one billion years look remarkably similar to living algae, and probably made modern sterols. That would suggest that modern sterols — not just their precursors — should also be present in rocks that are more than 800 million years old. “The finding raises as many questions as it answers,” he says.
And although there are reasons to suspect that the protosterols were made by eukaryotes, the researchers have not yet been able to rule out the possibility that they were made by ancient bacteria, says Susannah Porter, a palaeontologist who focuses on early eukaryote evolution at the University of California, Santa Barbara.
But the team’s approach — using hypotheses about the evolution of biosynthetic pathways to guide the search for ancient life — could reveal more about early life, she adds. “It’s thinking about the record of biomarkers from an evolutionary perspective,” Porter says. “And I think that’s needed.”
The golden snub-nosed monkey (Rhinopithecus roxellana) is one of only a handful of primate species that have complex multilevel social structures.
Credit: Sylvain Cordier/Gamma-Rapho via Getty
The largest ever study of primates has unveiled surprises about humanity and our closest relatives, providing insight into which genes do, and don’t, separate us from other primates. The huge international study has also yielded new data for a wide range of disciplines, including human health, conservation biology and behavioural science.
More than 500 species of primate exist today, including humans, monkeys, apes, lemurs, tarsiers and lorises. Many are threatened by climate change, habitat loss and illegal hunting. Researchers sequenced genomes from nearly half of all primate species, investigating more than 800 genomes from 233 species around the world, representing all 16 families of primate. The work has been published in a series of papers in Science and Science Advances this week1–10.
“The more we understand about primate genomics, the more we’ll understand about human genomics,” says primatologist Alison Behie at the Australian National University in Canberra. “There’s a potential there to do a lot more really interesting work as they grow that sample size to bring in more species.”
Huge expansion
Five years ago, scientists had sequenced genomes from less than 10% of primate species, says one of the project leaders, Dong-Dong Wu, an evolutionary biologist at the Chinese Academy of Sciences in Kunming.
The effort started after a team headed by Kyle Farh at sequencing company Illumina, based in San Diego, California, developed a way to estimate whether mutations in the human genome would cause disease by looking for the same mutations in great apes11. The work relied on ape genomes sequenced by Tomàs Marquès Bonet, a comparative genomics researcher at the University of Pompeu Fabra in Barcelona, Spain, and his colleagues, and demonstrated the power of looking beyond human genomes to investigate human diseases.
“Kyle called me one day, and essentially, he was asking if I had more genomes in the queue for sequencing,” says Marquès Bonet. The resulting project quickly attracted researchers from 24 countries who were keen to contribute samples and carry out sequencing. “There was an opportunity for conservation, evolution and understanding the human genome,” says Marquès Bonet.
“I am particularly proud of primatologists in Brazil and in India,” he says, because these hotspots for primate biodiversity were previously under-represented in genetic studies. “This is really a Herculean effort,” he says.
Sequencing is continuing. “It is not the end of this project, it is just the beginning,” says Wu. However, Marquès Bonet says tracking down samples from species that haven’t already been sequenced is becoming harder. “We are reaching a plateau,” he says. “Going from 233 to 300 is becoming extremely difficult.”
Human insights
The primate resource promises to help researchers improve their understanding of human biology and disease. In one study by Marquès Bonet and others, the genomes of the 233 primate species were used to classify 4.3 million common gene variants present in the human genome2. By assessing how common those variants were across species, the researchers were able to infer that around 98.7% of the variants they checked are probably benign in humans. This information could be used to help identify disease-causing mutations in people who have had their whole genome or their exome — the protein-coding portion of the genome — sequenced.
In another study, Wu and his colleagues compared the genomes of 50 species to map how the primate family tree evolved3. They identified thousands of genetic sequences that became dominant over evolutionary time in various branches of the tree. For instance, genes involved in brain development arose in the common ancestors of humans, apes and new world monkeys, and set the stage for the rapid evolution of large brains in humans. “Brain expansion began a long time ago,” says Wu.
Meanwhile, a large cache of gene variants thought to be unique to humans, because they are found in Homo sapiens but not in the archaic human relatives called Neanderthals and Denisovans, has turned out to be widespread across primates1. Almost two-thirds of the variants thought to be solely human were present in at least one other primate species, and more than half were found in two or more.
Genetics of social structure
An ambition of behavioural sciences is to identify genetic mechanisms that explain specific behaviours. One of the studies has drawn that link4. Xiao-Guang Qi, a behavioural ecologist at Northwest University in Xi’an, China, says that the five species of snub-nosed monkey are among only a handful of primates — including humans — that form complex multilevel societies in which large troops are composed of smaller family units. Two of the five — the golden snub-nosed monkey (Rhinopithecus roxellana) and the black-and-white snub-nosed monkey (Rhinopithecus bieti) — live in larger groups in cold, high-altitude environments.
By comparing the genomes of the social snub-nosed monkeys with genomes from less-social related monkeys, known as odd-nosed monkeys, and with those of more distant primate relatives, Qi and his colleagues identified genes that seem to be connected with the formation of large multilevel societies. The group found that changes in climate more than six million years ago drove the monkeys’ social structure to shift from small groups with one male and a few females to complex societies with multiple males and females.
“It’s not the present environment that neatly explains their social organization, it’s what happened in the past that’s probably equally important or even more important,” says co-author Cyril Grueter, an evolutionary anthropologist at the University of Western Australia in Perth.
Qi says that changes to the brain hormones dopamine and oxytocin were involved. These neurotransmitters are key to forming social bonds and Qi says that colder conditions required closer bonding between females and their young to ensure survival. This led to more bonded monkeys and larger group sizes, he says.
Grueter says the evolutionary origins of other behaviours, such as mating, could also be investigated using this approach.
The analysis of all 233 species’ genomes also has implications for conservation. For example, it shows that genetic diversity within a species does not align with its extinction risk1. That’s surprising, says Behie, because lower genetic diversity, which can result from inbreeding when population size diminishes, is widely considered a sign that a species is at risk of extinction. The finding suggests that for some threatened species, populations have declined so fast that there hasn’t been time for inbreeding to occur. This points to factors other than inbreeding — such as habitat destruction — being the greater threat to a species’ resilience.
doi: https://doi.org/10.1038/d41586-023-01776-6
References
Kuderna, L. F. K. et al.Science380, 906–913 (2023).
Beste bezoeker, Heb je zelf al ooit een vreemde waarneming gedaan, laat dit dan even weten via email aan Frederick Delaere opwww.ufomeldpunt.be. Deze onderzoekers behandelen jouw melding in volledige anonimiteit en met alle respect voor jouw privacy. Ze zijn kritisch, objectief maar open minded aangelegd en zullen jou steeds een verklaring geven voor jouw waarneming! DUS AARZEL NIET, ALS JE EEN ANTWOORD OP JOUW VRAGEN WENST, CONTACTEER FREDERICK. BIJ VOORBAAT DANK...
Druk op onderstaande knop om je bestand , jouw artikel naar mij te verzenden. INDIEN HET DE MOEITE WAARD IS, PLAATS IK HET OP DE BLOG ONDER DIVERSEN MET JOUW NAAM...
Druk op onderstaande knop om een berichtje achter te laten in mijn gastenboek
Alvast bedankt voor al jouw bezoekjes en jouw reacties. Nog een prettige dag verder!!!
Over mijzelf
Ik ben Pieter, en gebruik soms ook wel de schuilnaam Peter2011.
Ik ben een man en woon in Linter (België) en mijn beroep is Ik ben op rust..
Ik ben geboren op 18/10/1950 en ben nu dus 75 jaar jong.
Mijn hobby's zijn: Ufologie en andere esoterische onderwerpen.
Op deze blog vind je onder artikels, werk van mezelf. Mijn dank gaat ook naar André, Ingrid, Oliver, Paul, Vincent, Georges Filer en MUFON voor de bijdragen voor de verschillende categorieën...
Veel leesplezier en geef je mening over deze blog.


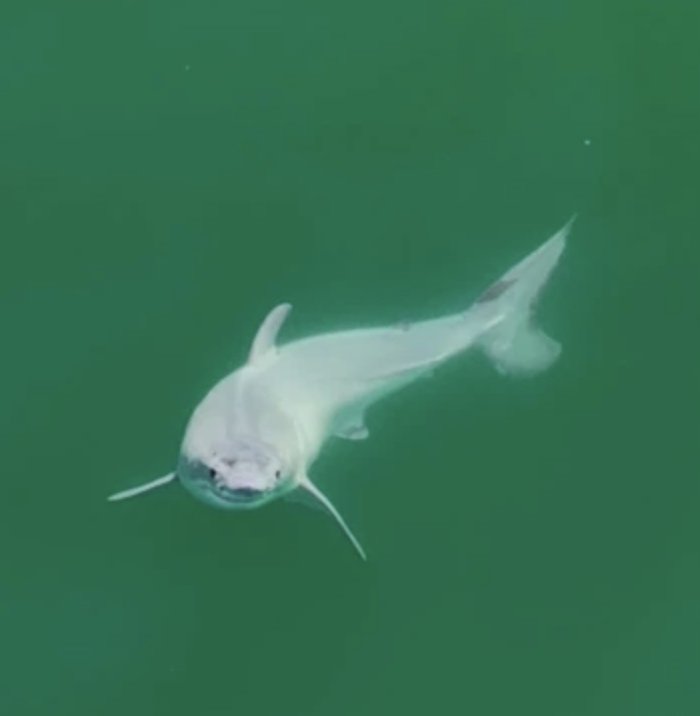
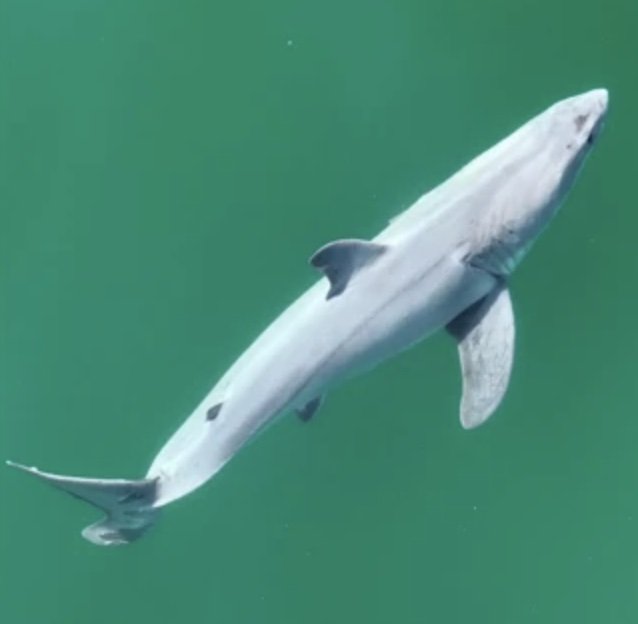

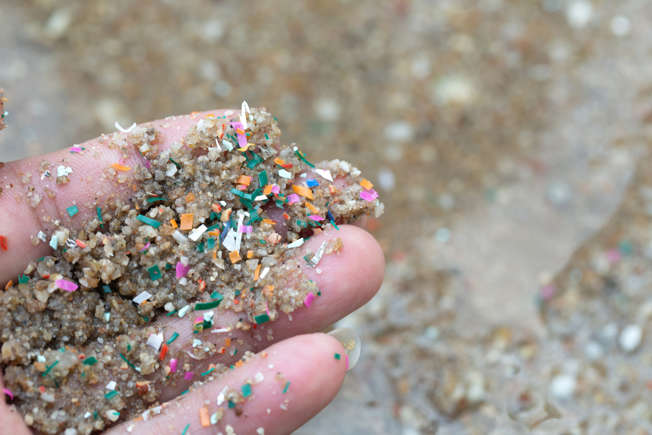
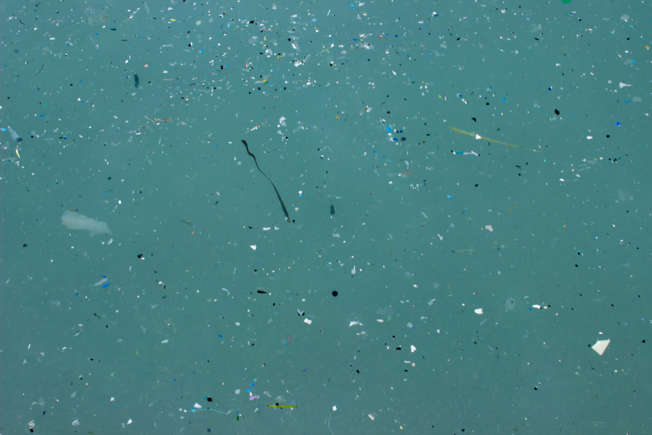
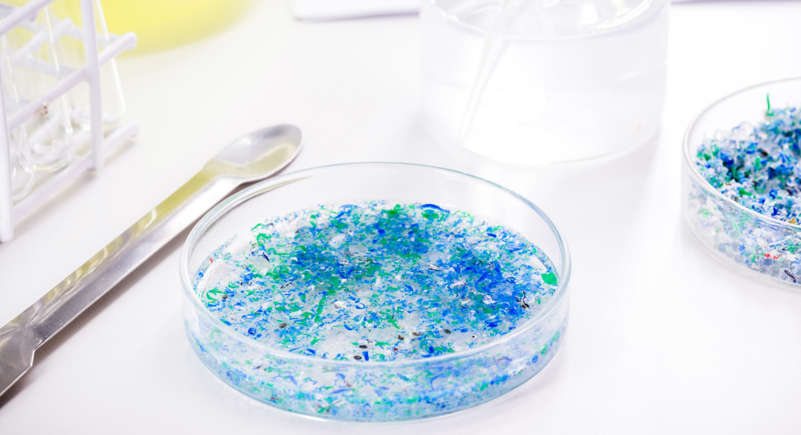
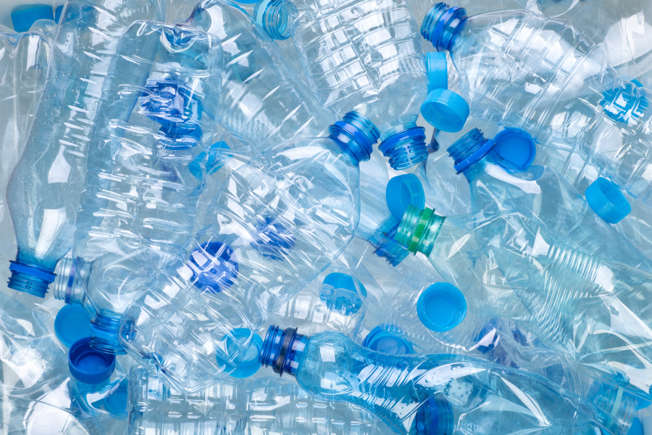
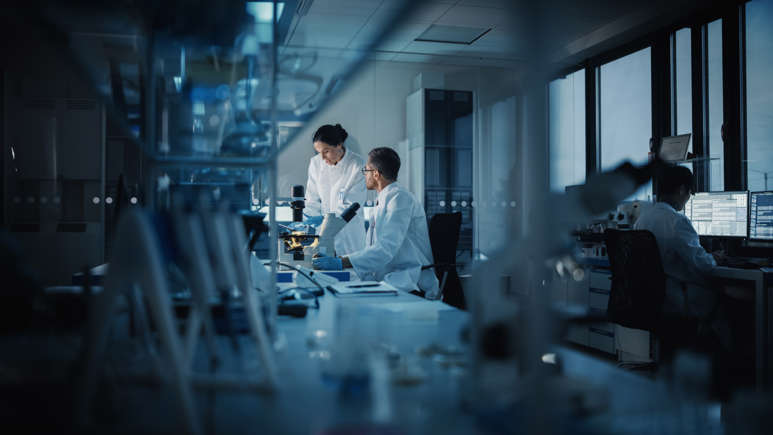
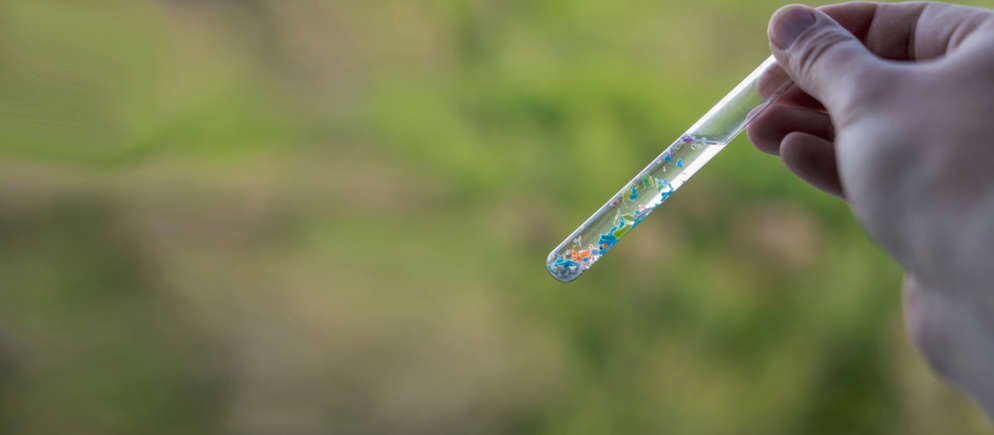
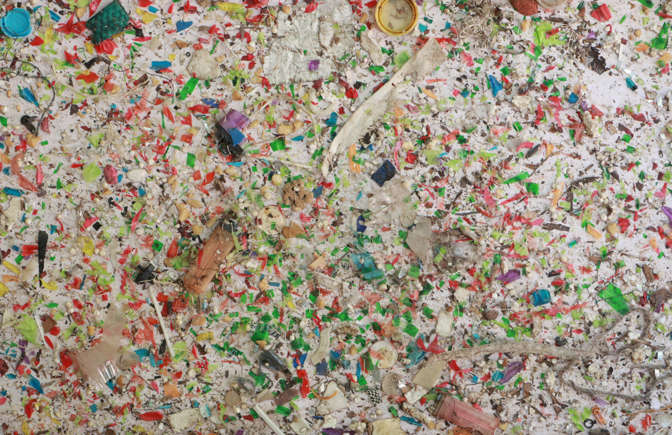
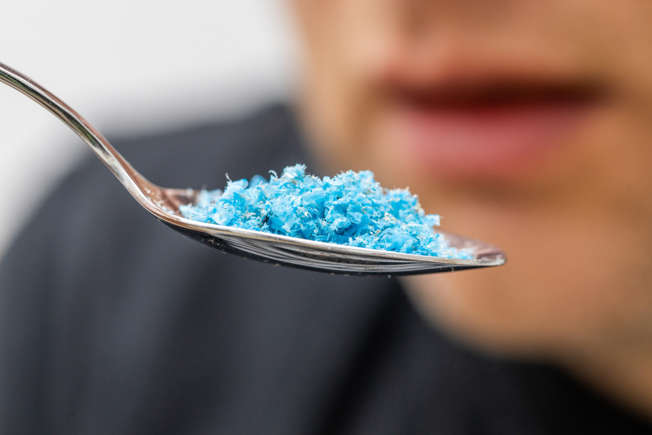
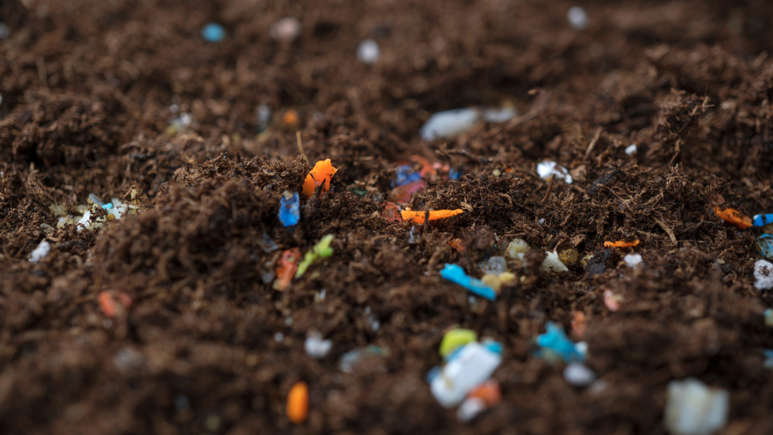
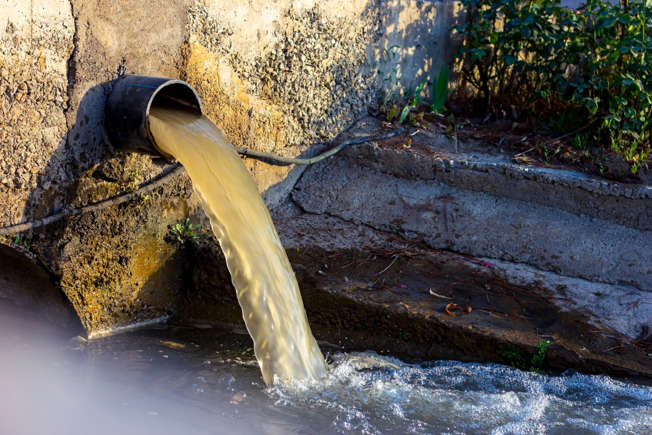


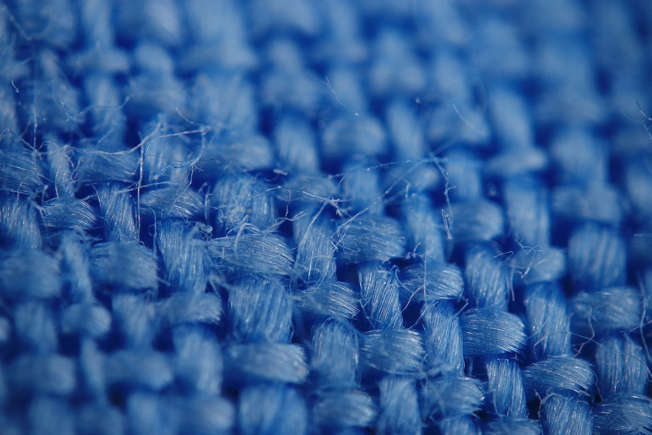

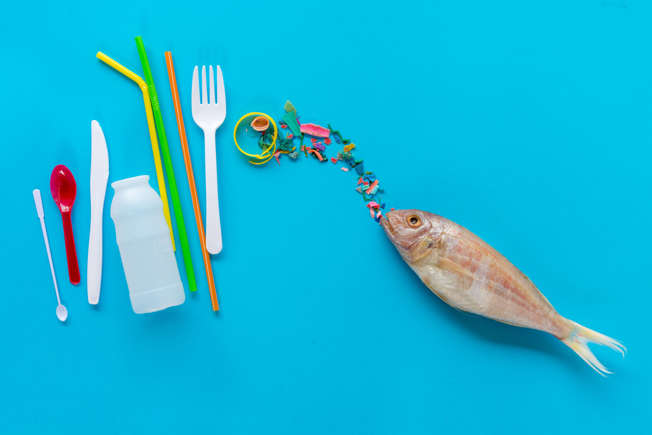
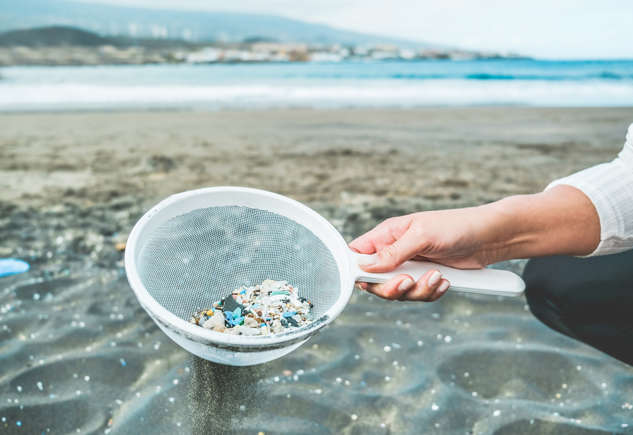
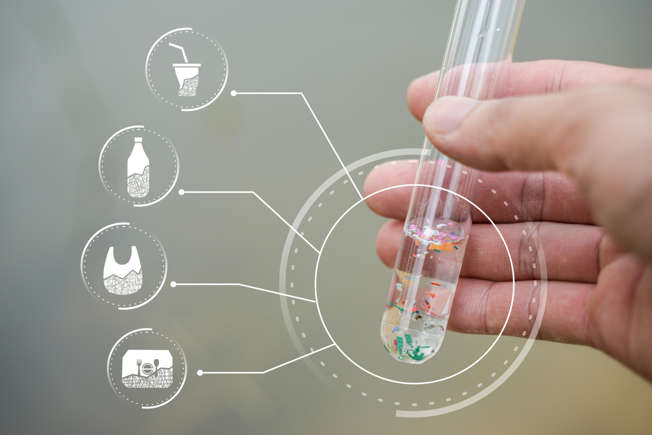
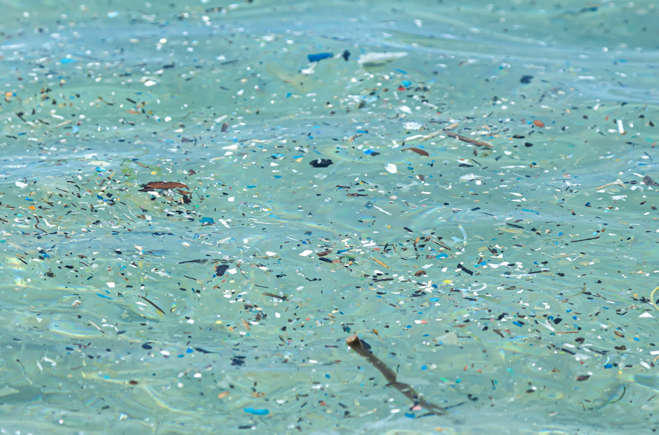

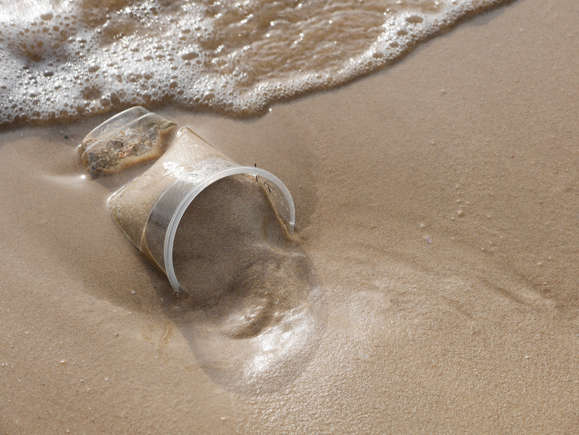
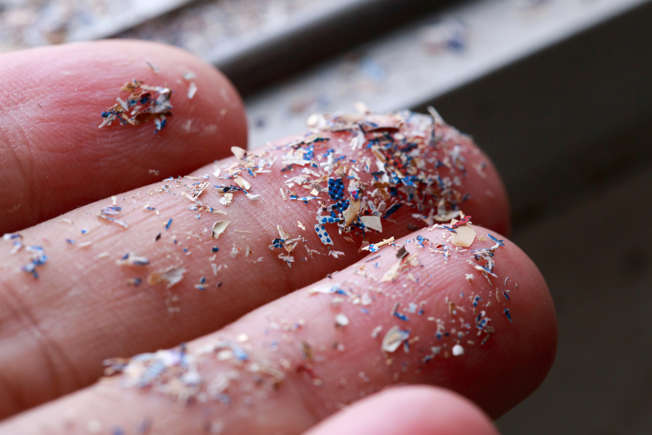
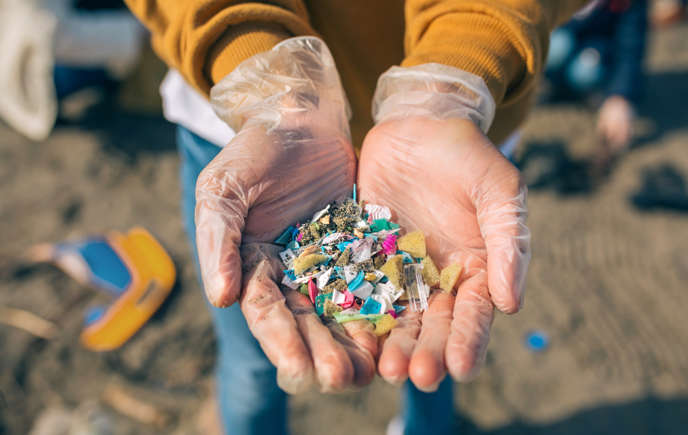
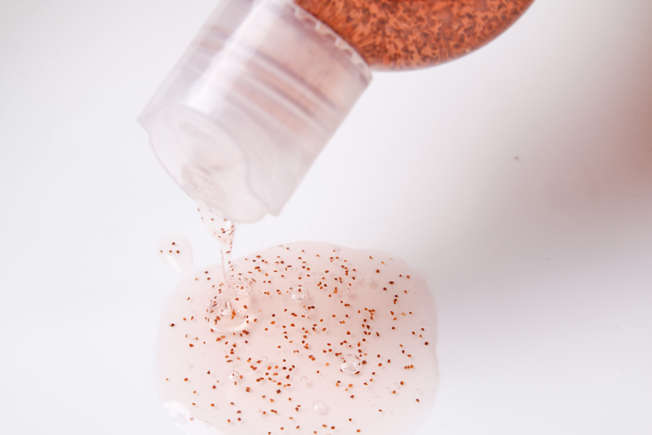
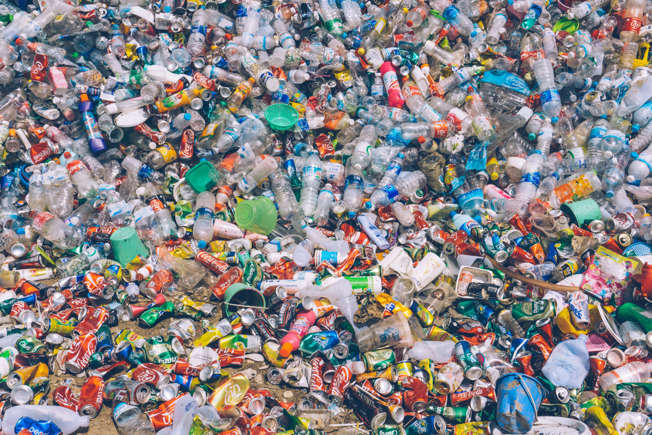
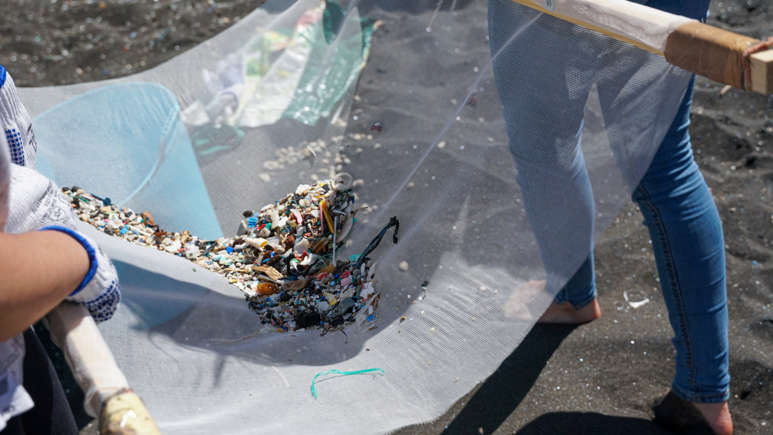
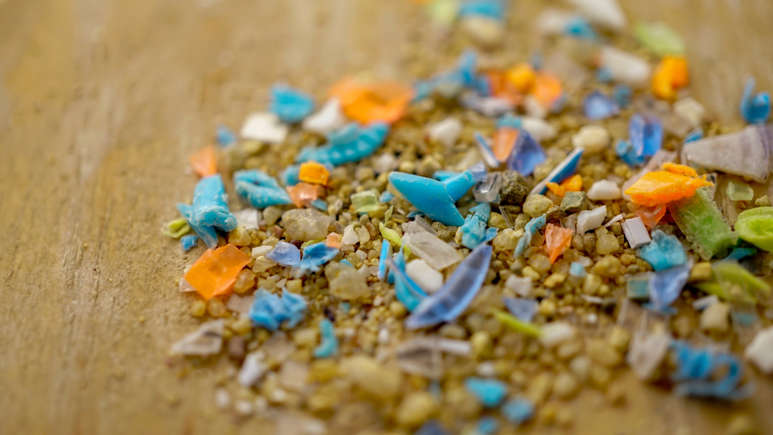
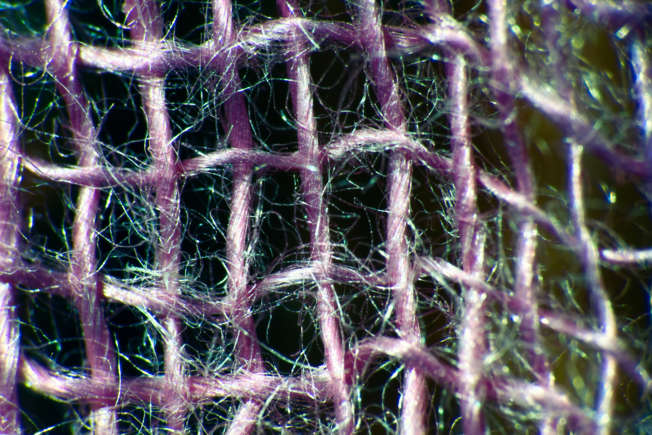
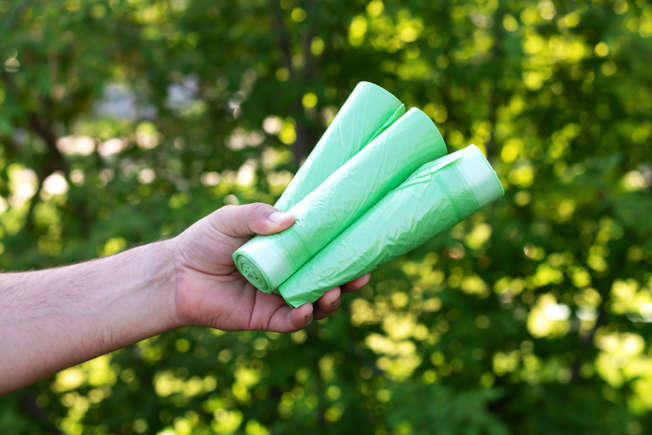

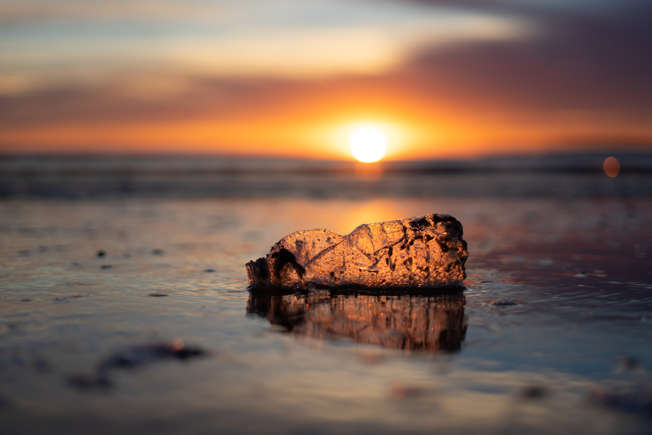
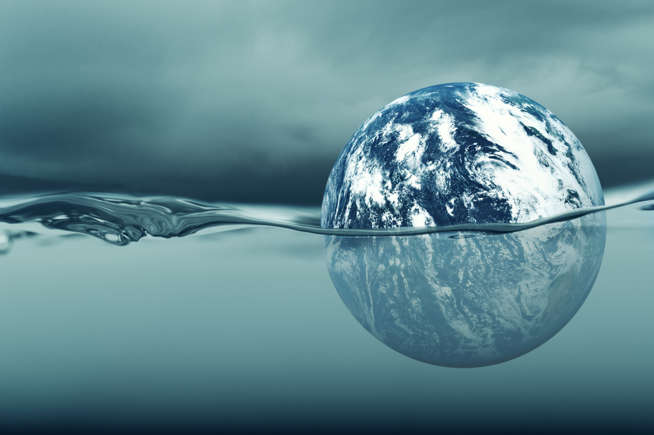
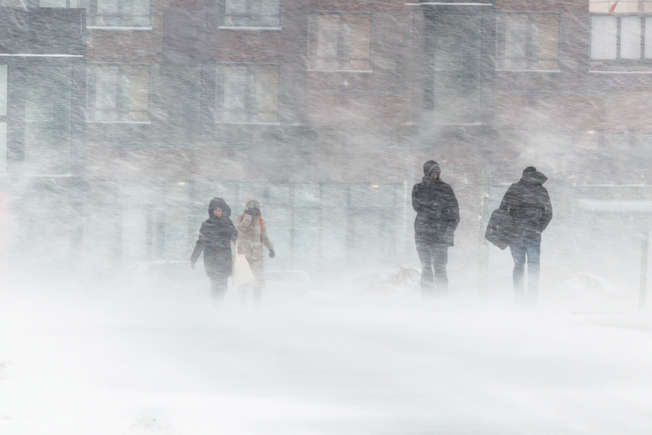
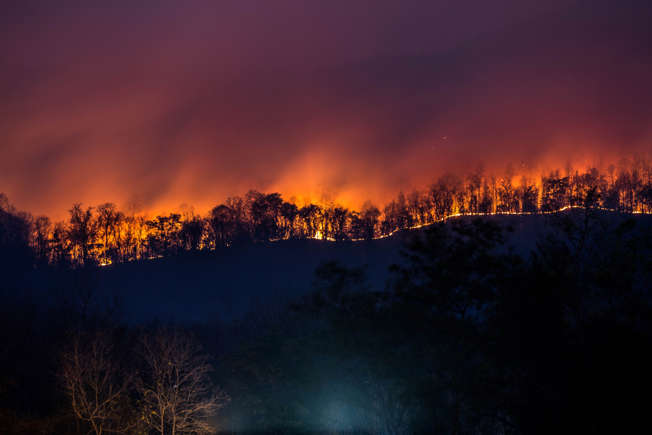
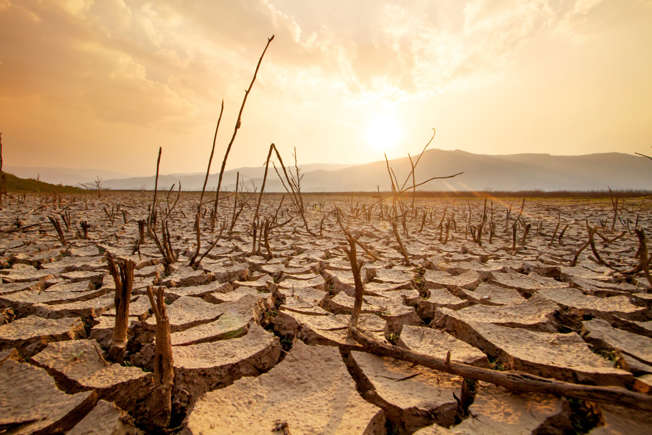
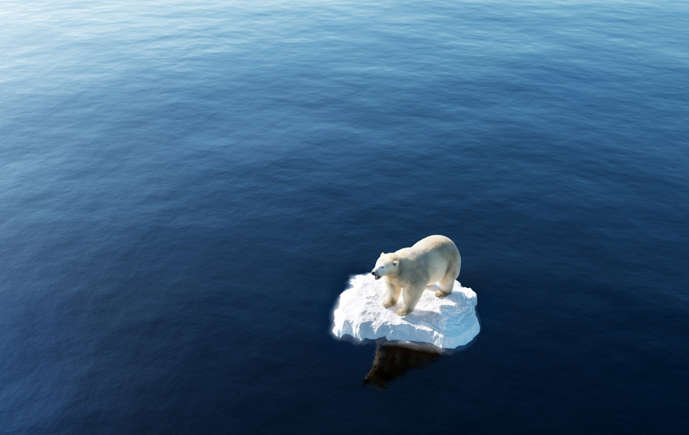


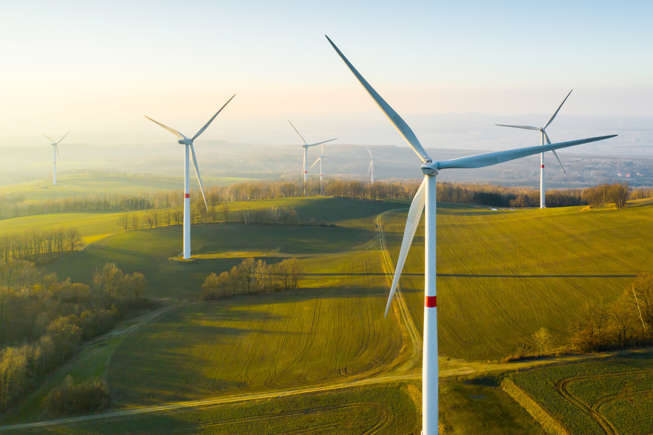

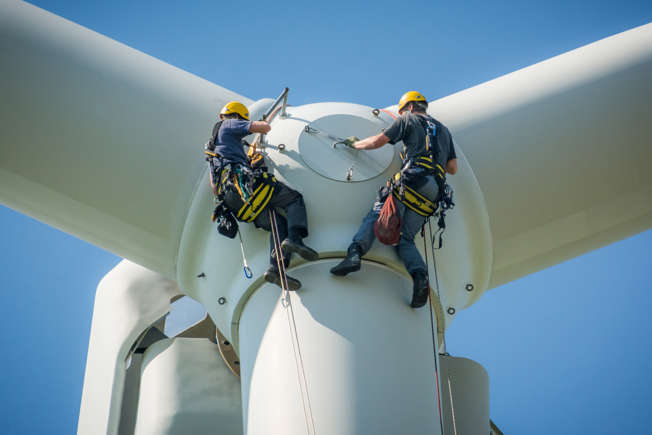
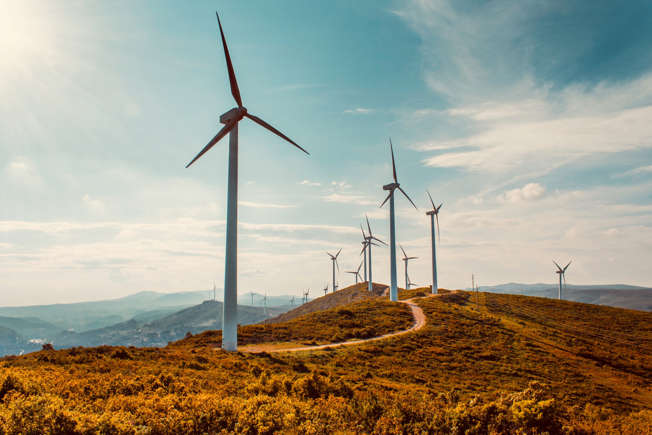
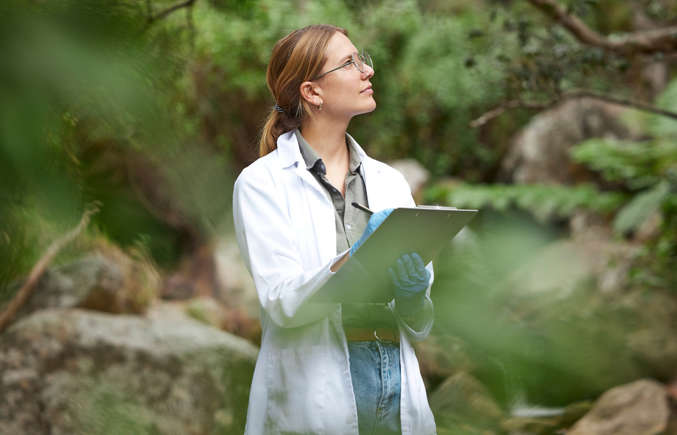
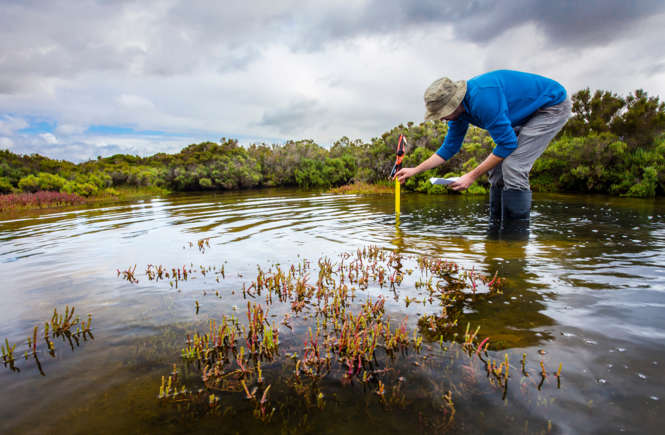
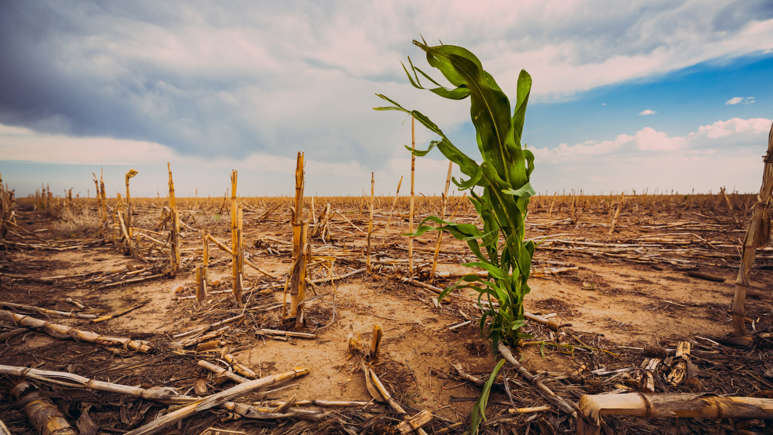
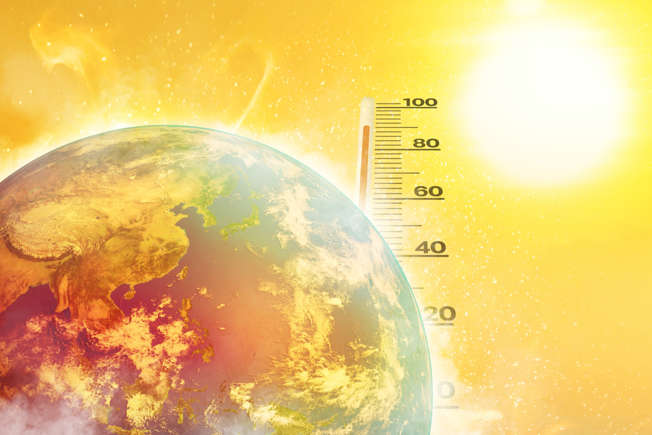


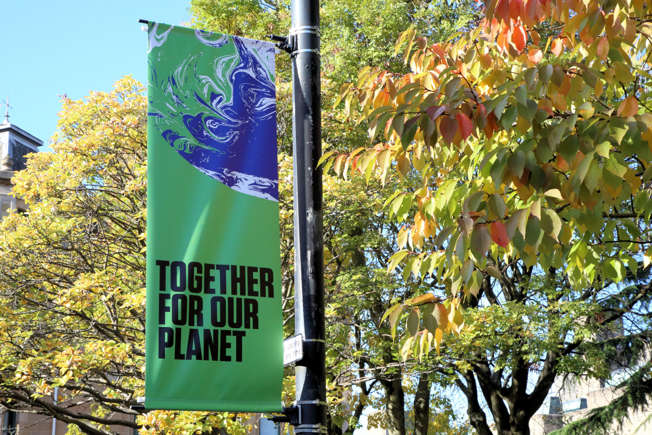

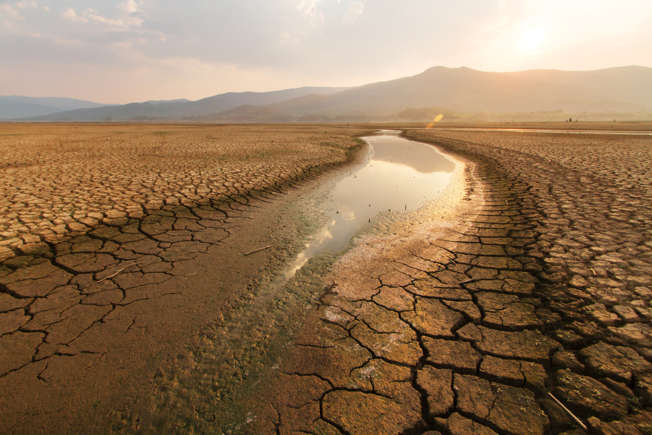
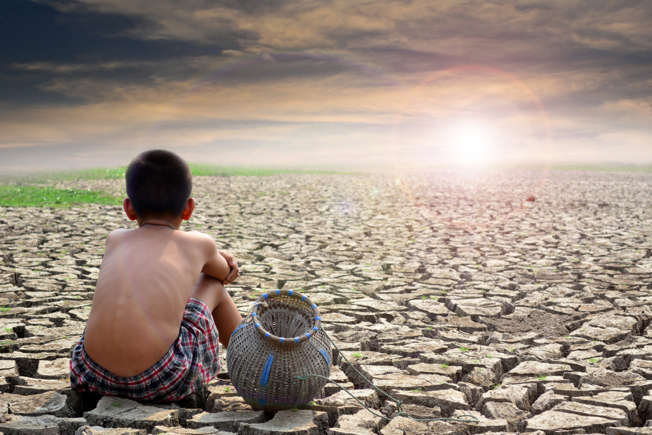

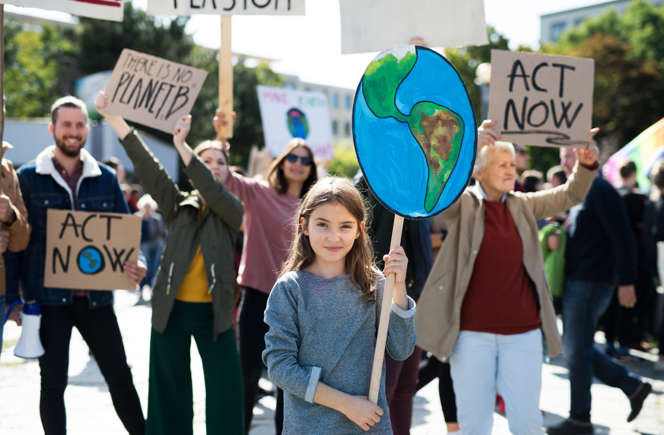
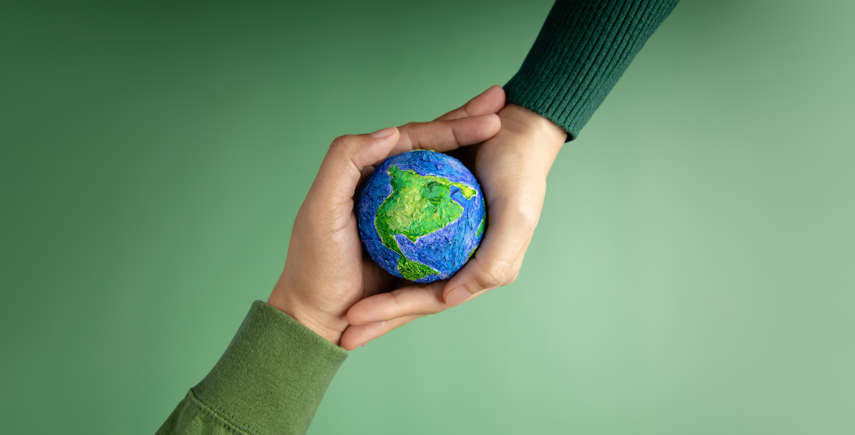

. In november waren er zelfs twee pieken boven de 2 graden.")